罗曼-加尔巴
介绍
近年来,移动游戏通过展示应用内广告所实现的收益得到了大幅提升,尽管面对诸多挑战,广告收入依然有巨大的潜力。众多游戏发行商开始采用“混合变现”模式,应用内广告(IAA) 和 应用内购(IAP)相结合。
尽管IAA与IAP的比例仍存在争议,如50/50、70/30或80/20的分配模式,但有一个事实不容忽视,那便是广告收入在绝大多数移动发行商的总收入中所占的比重相当大。
Tenjin公司携手 Clever Ads Solutions (CAS),为发行商提供独家的广告变现数据。这份报告基于Tenjin的样本和CAS.AI按照国家和广告形式分类的平均eCPM基准,分析了各大广告变现渠道及国家的市场份额。
此报告将持续更新,每季度补充数据
Last updated on October 21, 2026
- Q3 2026 dataset has been added.
- Q3 results are compared with Q2 2026 to highlight the latest platform, network, and geographic changes.
Q3 2026 Executive Summary
iOS moved ahead of Android in mobile ad revenue share in Q3 2026, while Applovin took the leading network position on both platforms. Country-level revenue became less concentrated in the US compared to Q2.
The latest Q3 data highlights five main changes:
- IOS accounted for 52% of ad revenue, up from 45% in Q2. Android’s share moved from 55% to 48%.
- AppLovin strengthened its iOS lead and moved into first place on Android. Its share reached 53% on iOS and 29% on Android, compared with 44% and 23% in Q2.
- Mintegral declined on both platforms, losing 5% on iOS and 1% on Android.
- United States is still the largest individual market, but its share continues to decrease on both platforms.
- Countries outside the top ten accounted for a larger share of revenue, reaching 20% on iOS and 34% on Android.
Please note that these figures describe the distribution of ad revenue from within Tenjin’s own dataset. These changes in share do not on their own represent absolute revenue that has increased or decreased.
Ad Revenue Share by Platform in Q3 2026
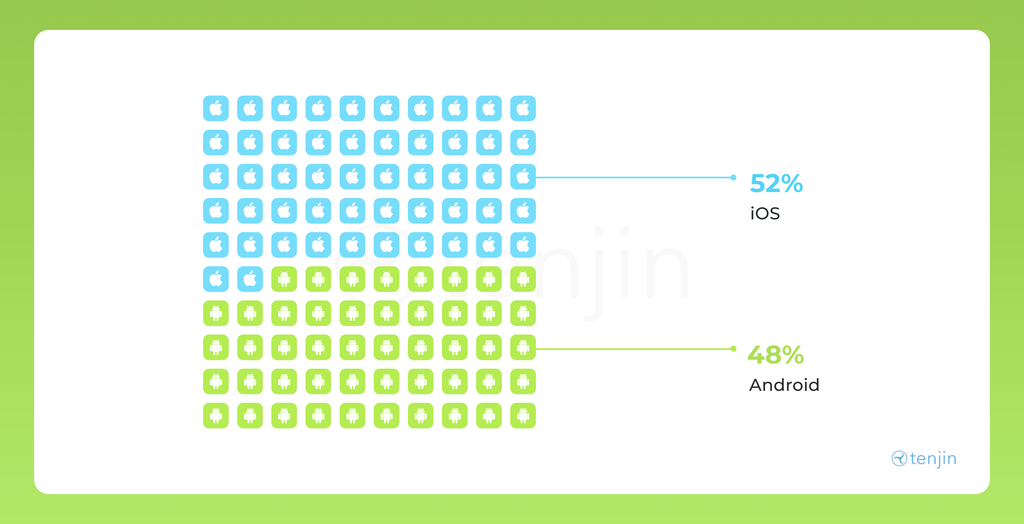
iOS accounted for 52% of mobile game ad revenue in Q3 2026, compared with 48% for Android. This puts iOS ahead after Android led in both Q1 and Q2.
The shift toward iOS accelerated this quarter. Its share rose by 7 percentage points from Q2, following a 2-point increase between Q1 and Q2. Android’s 10-point lead in Q2 became a 4-point lead for iOS in Q3.
For publishers, this gives a reason to revisit standard platform assumptions. Compare the revenue contribution of your iOS and Android audiences with your acquisition costs and retention data to understand what this shift means for your own games.
Ad Revenue Share by Ad Network in Q3 2026
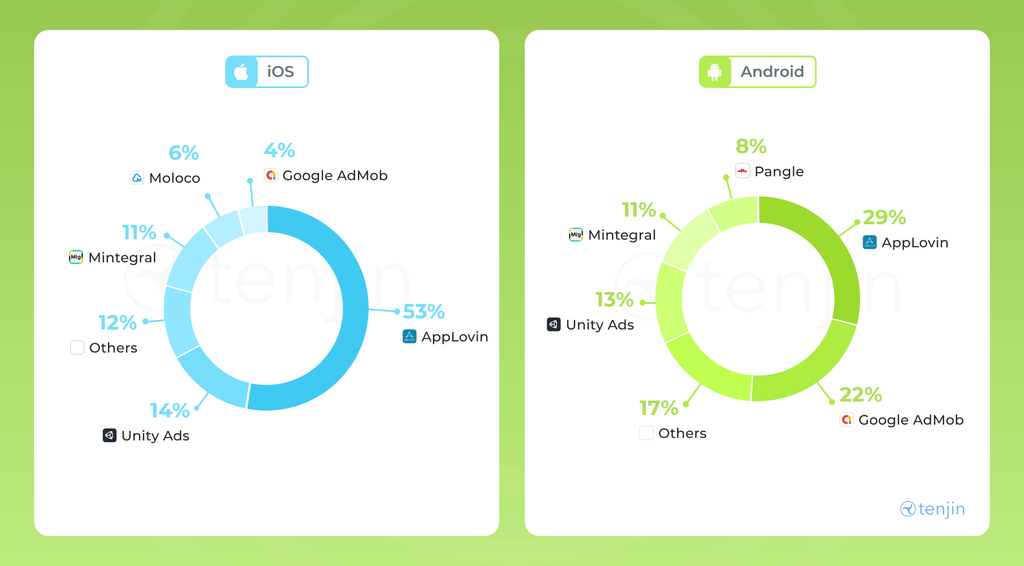
AppLovin now leads ad revenue share on both platforms, although its position remains considerably stronger on iOS. On iOS, AppLovin accounted for 53% of ad revenue, up from 44% in Q2.
Unity Ads held steady at 14%, moving ahead of Mintegral, which declined from 16% to 11%. Moloco appears as a separately listed network at 6%, followed by Google AdMob at 4%. Other networks collectively accounted for 12%.
On Android, AppLovin increased its share from 23% to 29%, overtaking Google AdMob, which moved from 25% to 22%. Unity Ads reached 13%, Mintegral accounted for 11%, and Pangle held 8%.
Other networks contributed the remaining 17%. The difference between platforms is still clear. AppLovin generated more than half of iOS ad revenue in the dataset, while Android revenue remained more evenly distributed across networks. Publishers can use this breakdown to compare their own network mix and identify where a closer performance review may be useful.
Top 3 Ad Networks by Year-over-Year Ad Revenue Share Gain in Q3: 2025 vs. 2026
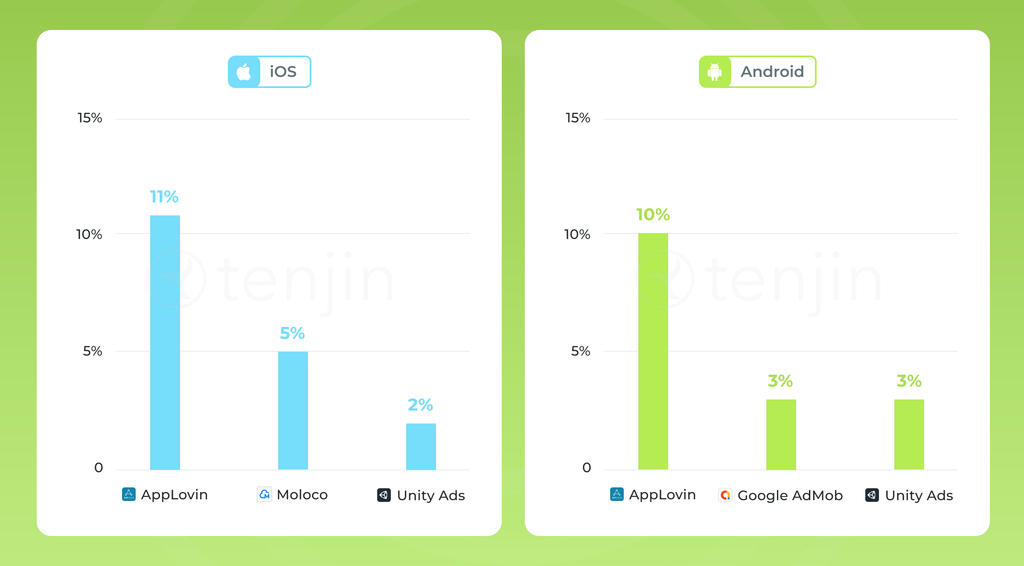
AppLovin recorded the largest year-over-year gain in ad revenue share on both platforms. Its iOS share increased by 11 percentage points, from 42% in Q3 2025 to 53% in Q3 2026. On Android, it gained 10 points, moving from 19% to 29%.
Moloco followed on iOS with a 5-percentage-point gain, while Unity Ads gained 2 points. On Android, Google AdMob and Unity Ads each gained 3 points. Unity Ads appeared among the top three gainers on both platforms. Moloco’s position also makes it worth watching on iOS, where it accounted for 6% of revenue in the latest network breakdown.
Read this ranking alongside the revenue-share chart. Together, they show which networks contribute the most revenue and which have gained the most share over the past year. These share gains should not be interpreted as growth rates in absolute ad revenue.
iOS Ad Revenue Share by Country in Q3 2026
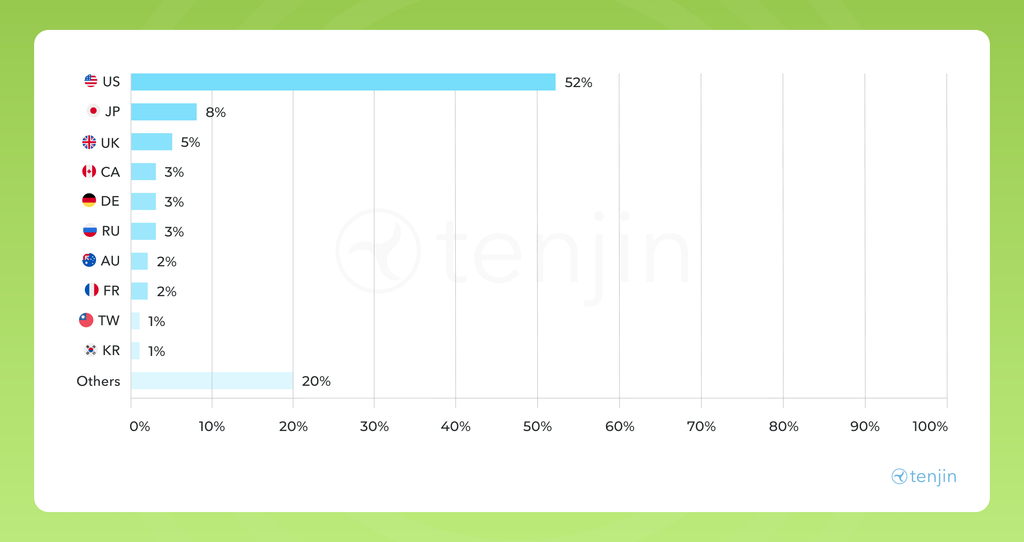
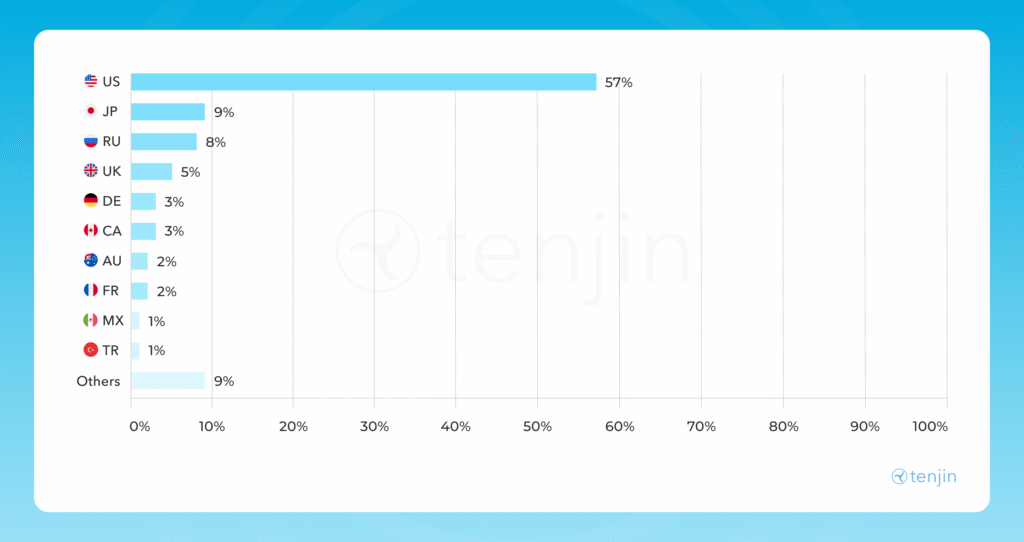
The US remained the largest iOS ad revenue market at 52%, down from 58% in Q2. Japan followed at 8%, while the UK accounted for 5%. Canada, Germany, and Russia each contributed 3%. Australia and France each accounted for 2%, with Taiwan and South Korea at 1% each.
The most notable change was the contribution from countries outside the top ten. Their combined share rose from 9% in Q2 to 20% in Q3. The composition of the top ten also changed, with Taiwan and South Korea appearing in place of Mexico and Türkiye.
The US still generated more than half of iOS ad revenue, but the latest distribution gives publishers a reason to consider and look more closely at a wider international audience. Country-level reporting can help identify which markets are contributing to revenue beyond the largest established sources.
Android Ad Revenue Share by Country in Q3 2026
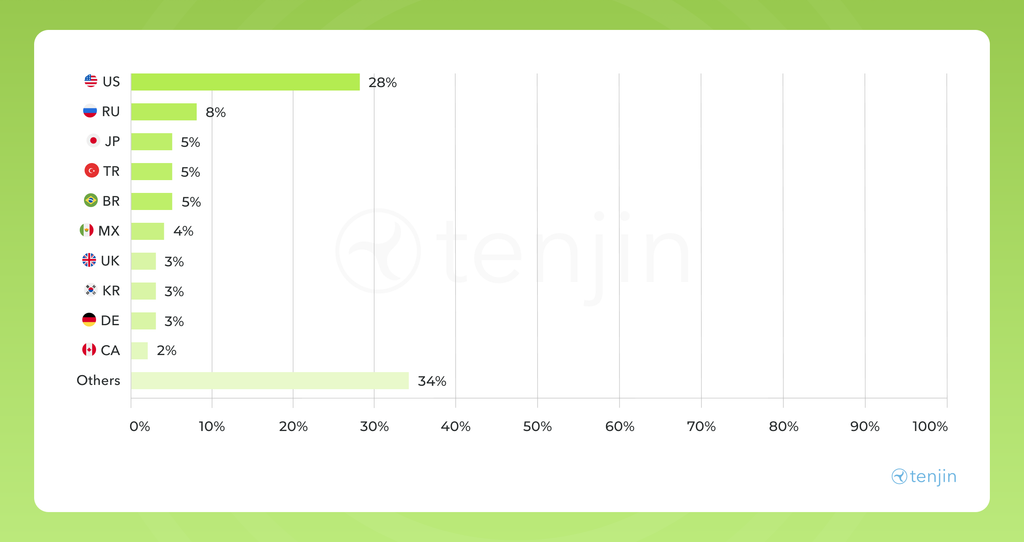
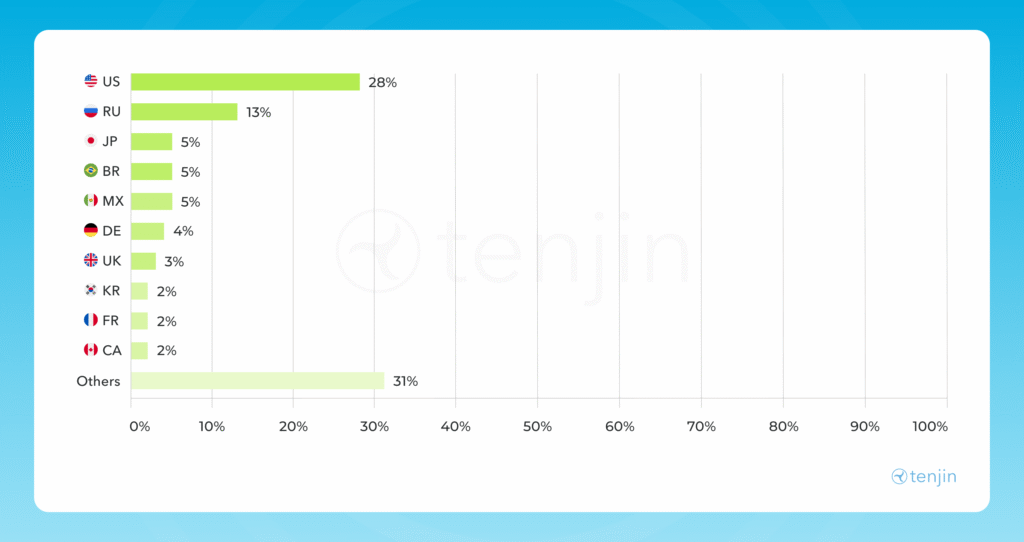
Android ad revenue continued to come from a broader mix of countries than iOS. The US led at 28%, down from 32% in Q2, while Russia’s share moved from 9% to 8%. Japan, Türkiye, and Brazil each accounted for 5%.
Türkiye entered the displayed top ten, while France was no longer listed separately. Mexico contributed 4%, followed by the UK, South Korea, and Germany at 3% each. Canada accounted for 2%.
Countries outside the top ten generated 34% of Android ad revenue, up from 32% in Q2. Collectively, these markets contributed more revenue than the US alone.
For publishers, that wider distribution makes country-level analysis particularly useful. Comparing revenue, acquisition costs, and user retention by market can help determine where to test localization or adjust monetization strategies.
What These Results Mean For Mobile Publishers
These benchmarks reveal why platform, network, and country performance needs to be reviewed together, as a whole. iOS has a larger share of ad revenue, AppLovin led both platforms, and countries ranking outside of the top ten continue to contribute a larger share of revenue.
Mobile publishers can use these findings to review their apps. Check whether the same changes follow the trend in your data and which networks contribute to revenue in each of your markets and how they perform over time. Use these findings to guide a review of your own games.
By combining ad revenue with acquisition costs, retention, and IAP revenue gives your team a holistic framework for evaluating where to test and scale.
Q2 2026 Executive Summary
The Q2 2026 data shows four notable changes:
- iOS increased its share of total ad revenue from 43% to 45%.
- AppLovin gained ad revenue share on both iOS and Android.
- Mintegral declined by 5 percentage points on both platforms.
- The US increased its share of ad revenue on both platforms, reaching 58% on iOS and 32% on Android.
Android still generates the majority of ad revenue in the dataset, but the gap between Android and iOS narrowed from 14 percentage points in Q1 to 10 percentage points in Q2.
Ad Revenue Share by Platform in Q2 2026
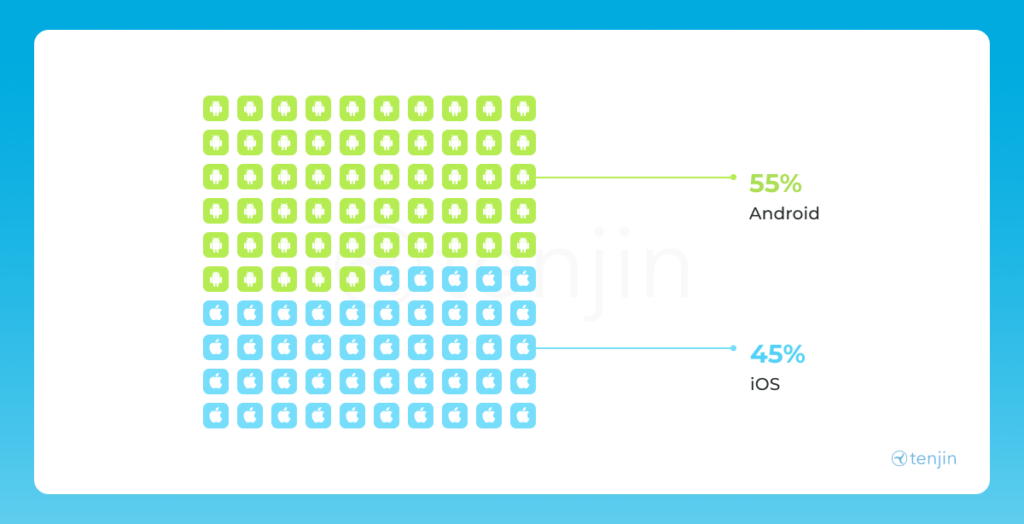
Android accounted for 55% of mobile game ad revenue in Q2 2026, compared with 45% for iOS.
This represents a 2-percentage-point shift toward iOS from Q1, when Android held 57% and iOS held 43%. Android remains the larger ad revenue platform, but the balance moved slightly closer in Q2.
The longer-term trend is therefore not a straight move toward Android. Platform share can shift from quarter to quarter, making it important for publishers to monitor actual revenue contribution rather than relying on assumptions about which operating system monetizes better.
Ad Revenue Share by Ad Network in Q2 2026
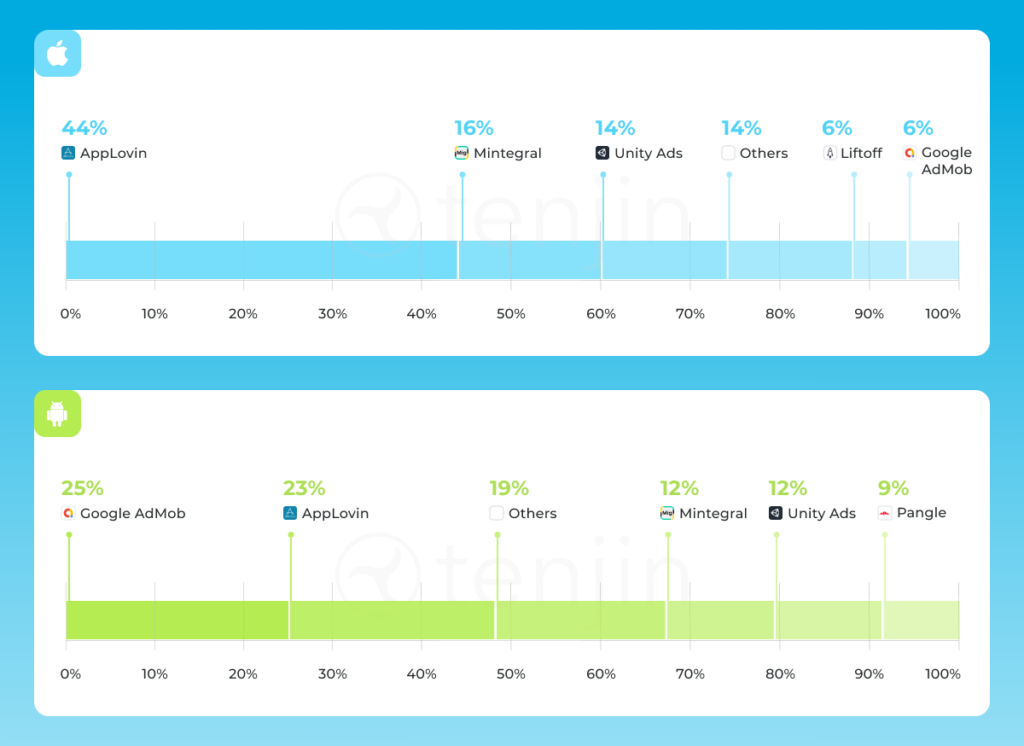
AppLovin strengthened its lead on iOS in Q2, increasing from 39% to 44% of ad revenue share. Mintegral moved in the opposite direction, falling from 21% to 16%.
Unity Ads and Others each increased slightly, from 13% to 14%. Liftoff and Google AdMob both declined from 7% to 6%.
As a result, the gap between the two largest iOS networks expanded considerably. AppLovin led Mintegral by 18 percentage points in Q1. By Q2, that lead had grown to 28 percentage points.
Android remained more competitive. Google AdMob held first place, increasing slightly from 24% to 25%, while AppLovin rose from 19% to 23%. The gap between the two leading Android networks narrowed from 5 percentage points to just 2.
Others remained unchanged at 19%, Unity Ads held steady at 12%, and Mintegral declined from 17% to 12%. Pangle appears as a separately identified network with 9% share in Q2, while Liftoff, which held 9% in Q1, is no longer shown separately.
The comparison reinforces how differently the two ecosystems behave. iOS became more concentrated around AppLovin, while Android retained a broader distribution across several networks.
Top 3 Ad Networks by Ad Revenue Growth YoY in Q2: 2025 vs 2026
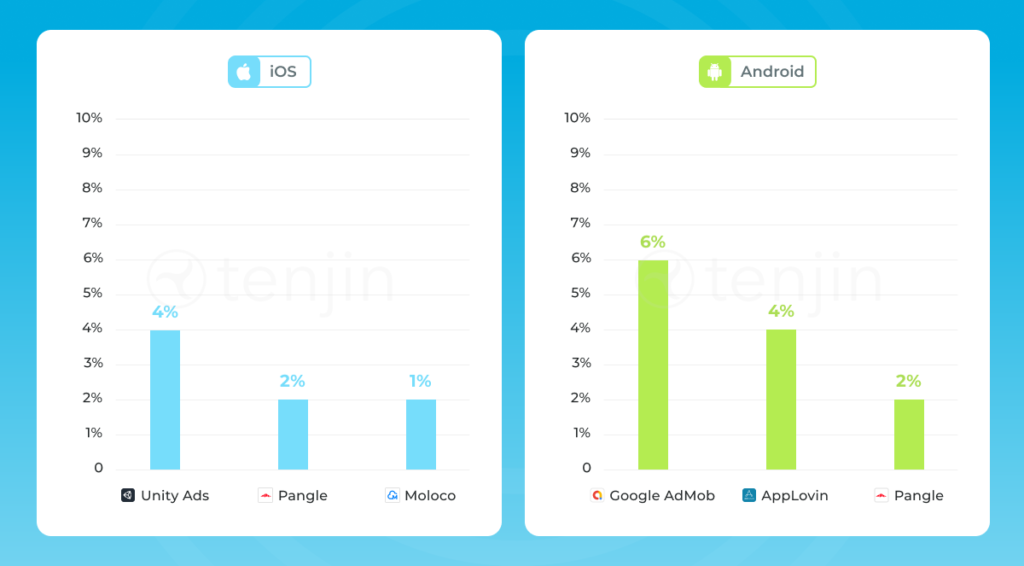
Unity Ads remained the leading network for year-over-year growth on iOS, increasing by 4%. It was followed by Pangle at 2% and Moloco at 1%.
Unity Ads was also the leading iOS growth network in Q1. However, the other two positions changed: Liftoff and Mintegral appeared in the Q1 ranking, while Pangle and Moloco entered the top three in Q2.
On Android, Google AdMob recorded the strongest year-over-year growth at 6%, compared with 3% in the Q1 year-over-year comparison. AppLovin followed at 4%, while Pangle remained among the top three with 2% growth.
This is a ranking of the networks recording the strongest year-over-year gains, not necessarily the networks generating the largest total share of ad revenue. Looking at both charts together helps distinguish market size from momentum.
iOS Ad Revenue Share by Country in Q2 2026
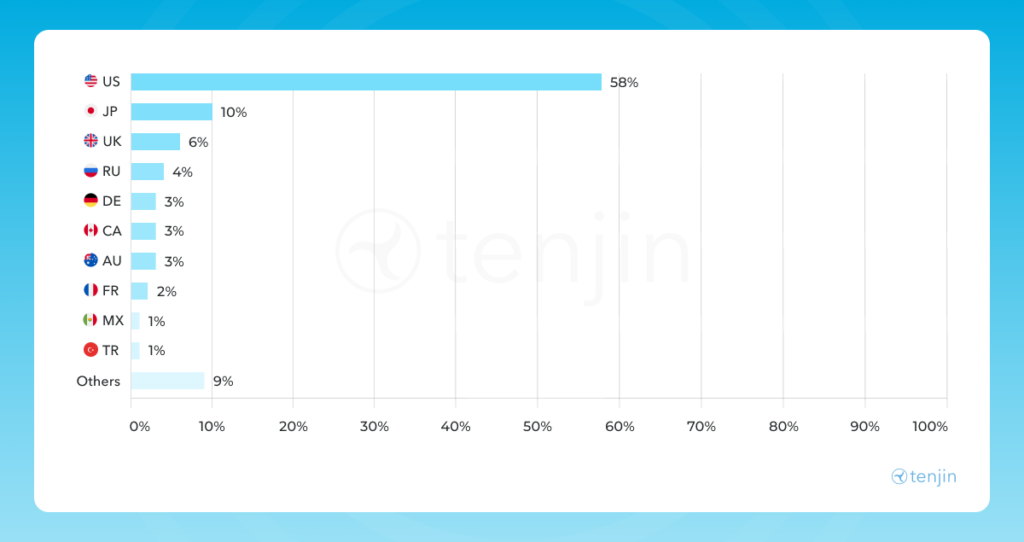
The US increased its share of iOS ad revenue from 56% in Q1 to 58% in Q2, reinforcing its position as the dominant iOS monetization market.
Japan remained second but declined slightly from 11% to 10%. The UK increased from 5% to 6%, overtaking Russia, which fell from 6% to 4%.
Germany and Canada remained unchanged at 3%. Australia increased from 2% to 3%, while France held steady at 2%. Mexico and Türkiye each accounted for 1%, and the share attributed to Others declined from 10% to 9%.
The overall picture became slightly more concentrated around the US. However, individual markets such as the UK and Australia still gained share, showing why country-level performance should be evaluated separately rather than through platform-wide averages alone.
Android Ad Revenue Share by Country in Q2 2026
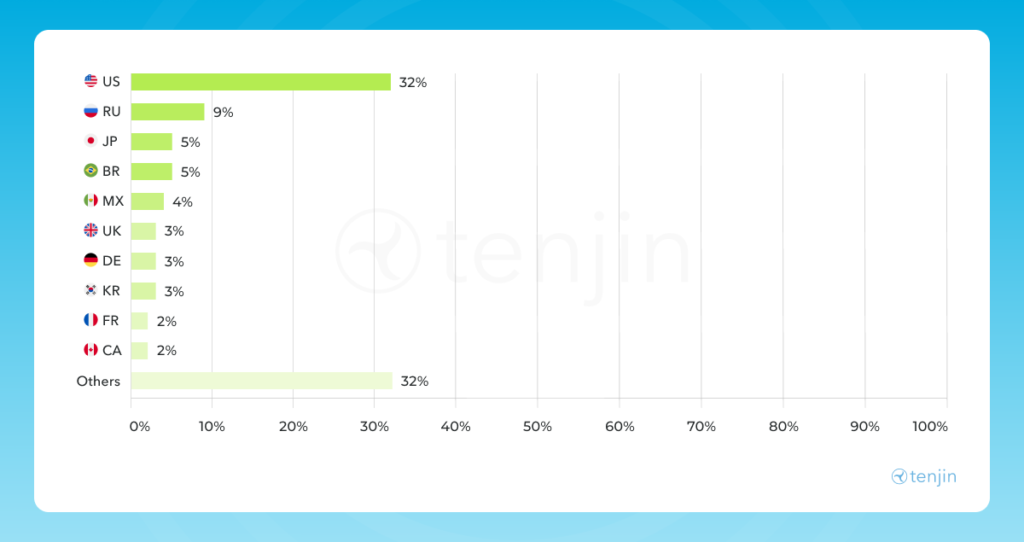
The US recorded the largest geographic increase on Android, rising from 28% in Q1 to 32% in Q2. Russia moved in the opposite direction, declining from 13% to 9%.
Japan and Brazil remained unchanged at 5%. Mexico increased from 3% to 4%, while South Korea moved from 2% to 3%. The UK and Germany each declined from 4% to 3%. France and Canada remained at 2%.
The share generated by countries outside the top ten remained unchanged at 32%. This is important because it shows that Android’s geographically distributed revenue base did not disappear. Instead, the most significant Q2 movement occurred between the two largest named markets, with the US gaining 4 percentage points and Russia losing 4.
2026年第一季度各平台广告收入份额
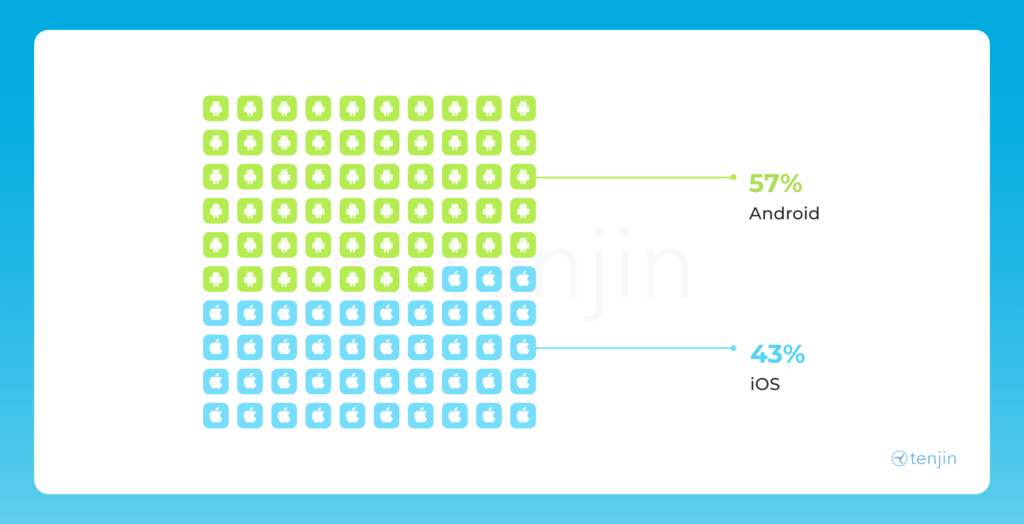
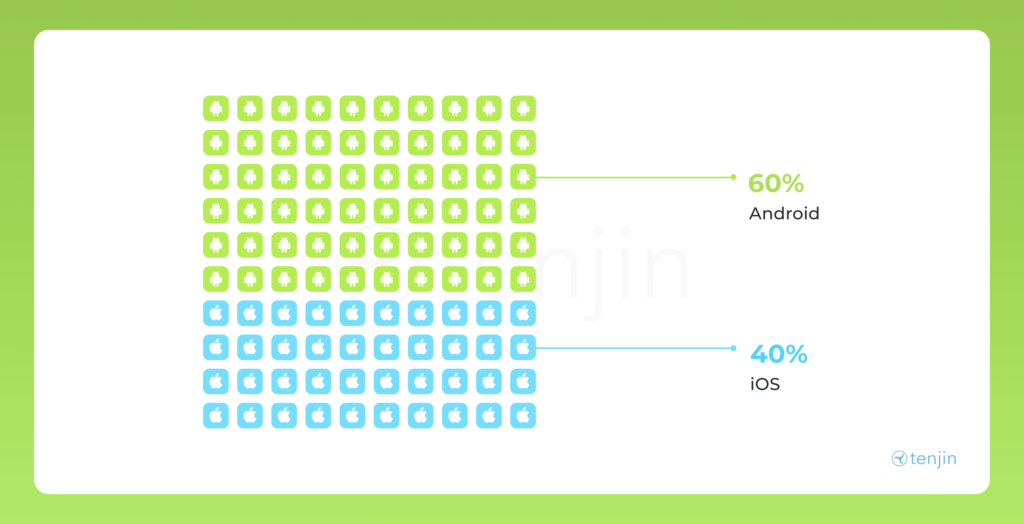
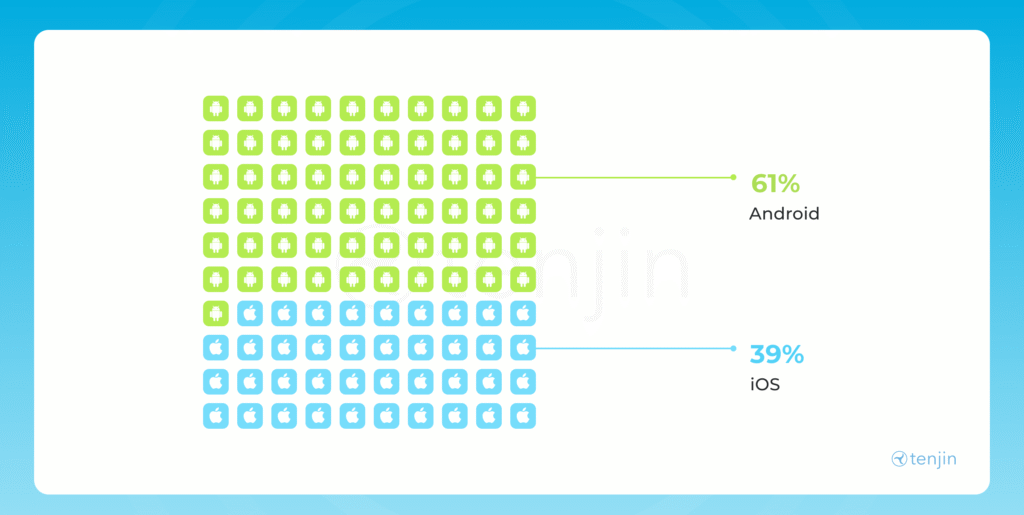
Android在广告收入份额上持续领先。2026年第一季度数据显示,其收入份额已达57%,显著高于iOS平台的43%。这一格局延续了自2025年第四季度以来的结构性转变趋势——当时Android平台就以60%的份额实现对iOS(40%)的超越。当前数据表明,这一市场分化趋势正持续巩固,值得行业深度关注。
虽然份额差距看似细微,但这一变化极具意义。Android平台长期依托更大的全球设备基数长期以规模见长,而如今这种规模优势正系统性地转化为收入优势——数据显示其已占据明确的收入主导地位,这表明两大平台间长期存在的变现差距正在显著收窄。
2026年第一季度各广告渠道的广告收入份额
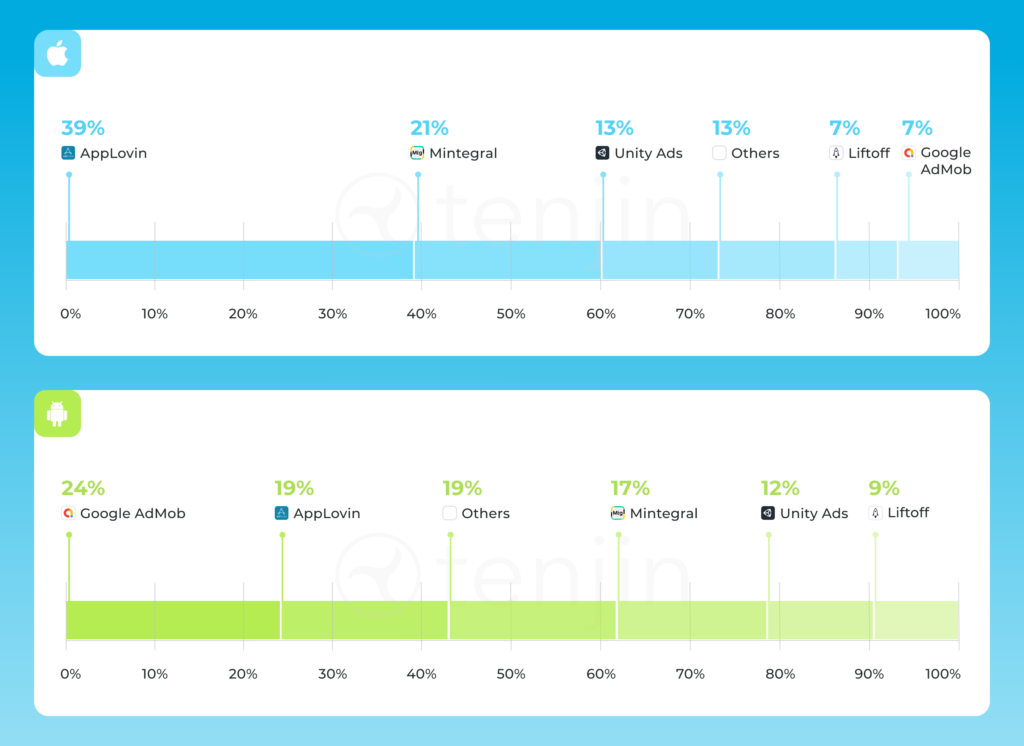
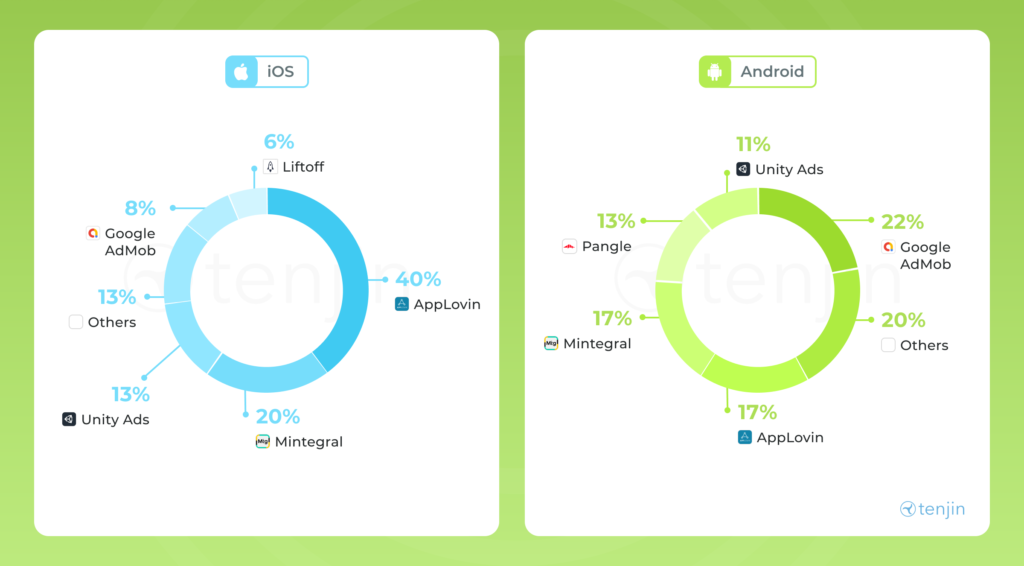
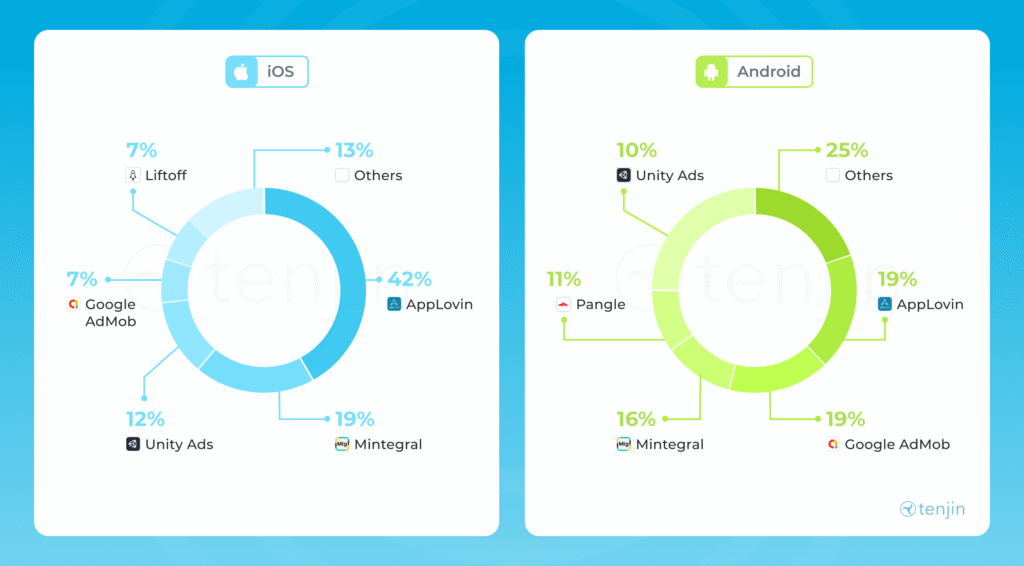
各广告渠道在不同平台的表现差异显著。 2026年第一季度,在iOS平台,AppLovin以39%的收入份额占据主导地位,领先其他渠道。紧随其后的是Mintegral,占比21%,Unity Ads与其他渠道各占13%,Liftoff和Google AdMob则各占7%。
而在Android平台,情况则完全不同。Google AdMob以24%的份额领先,但市场竞争格局更为激烈。AppLovin占比19%,与“其他渠道”类别份额持平,Mintegral占17%,Unity Ads占12%,Liftoff占9%。没有任何一家渠道形成绝对优势。
这种平台间的结构性差异,进一步印证了贯穿本报告的核心洞察。
广告收入的Top 3广告渠道,第一季度同比增长: 2025vs20266
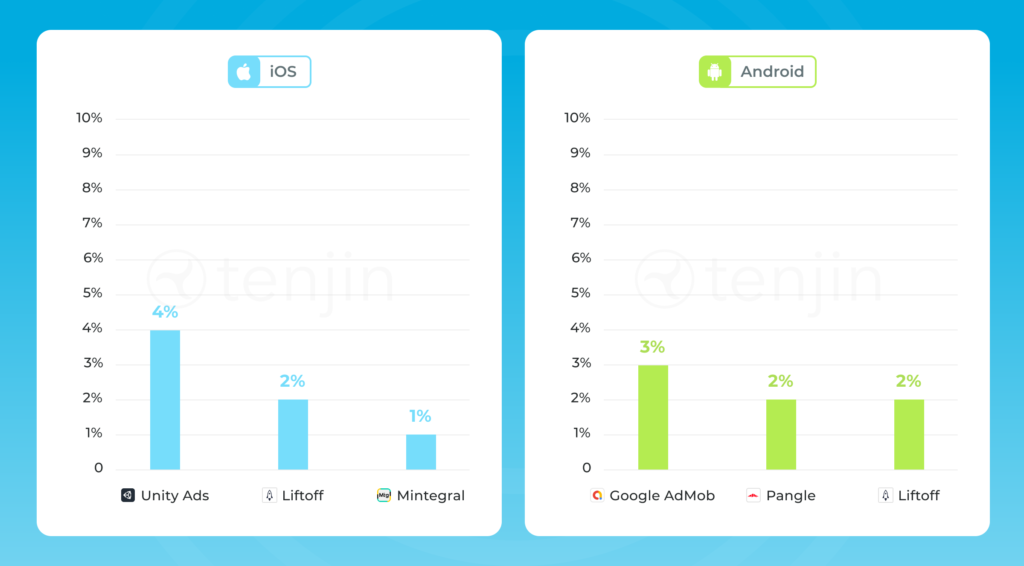
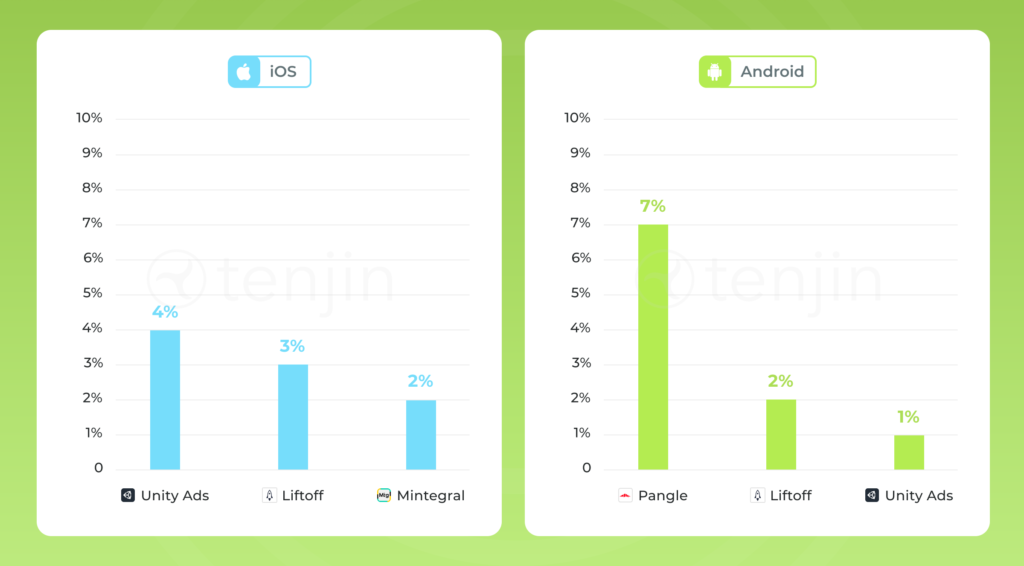
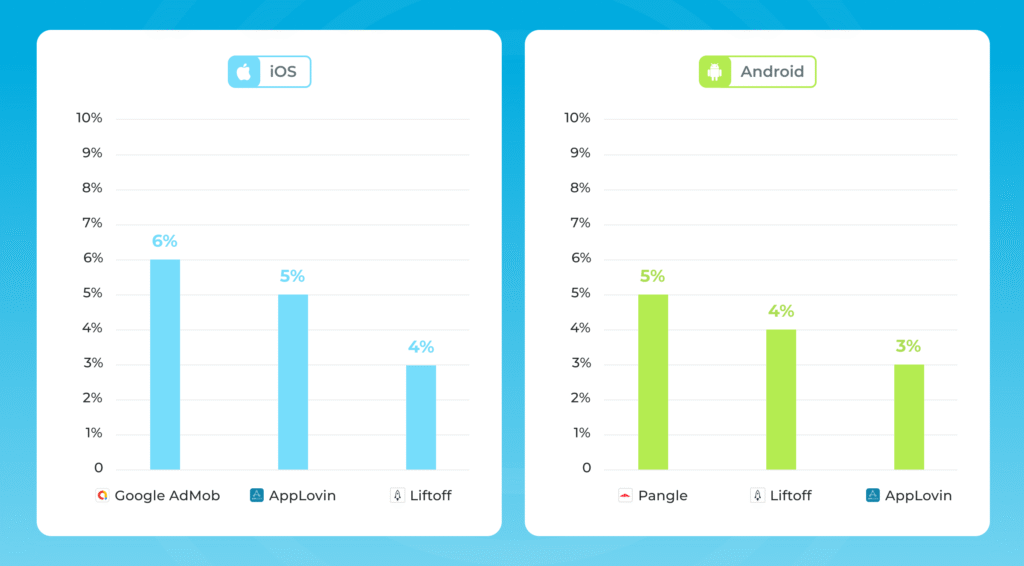
增长呈现出选择性,且形成了规律。在iOS平台,Unity Ads以4%的同比增幅领先,Liftoff(2%)和Mintegral(1%)紧随其后。在Android平台,Google AdMob、Pangle和Liftoff分别实现3%、2%和2%的增长。
对比2025年第四季度数据(Pangle在Android平台曾实现7%的显著增长,Unity Ads则在iOS平台以4%增幅领先),尽管Pangle本季度增速有所放缓,但仍稳居Android平台前三。值得注意的是,Unity Ads和Liftoff是唯一在两个平台、连续两个季度都保持稳定增长的渠道。
这揭示了一个重要洞察:最具观察价值的渠道并非当前市场份额最大者,而是那些能够持续展现增长动能、跨周期保持上升势头的参与者。
2026年第一季度各国iOS广告收入份额6
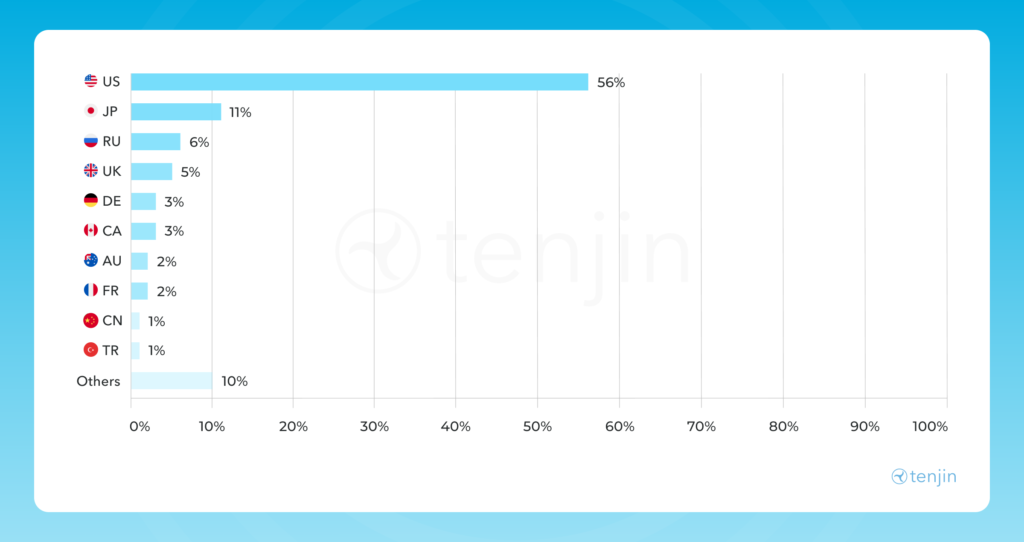
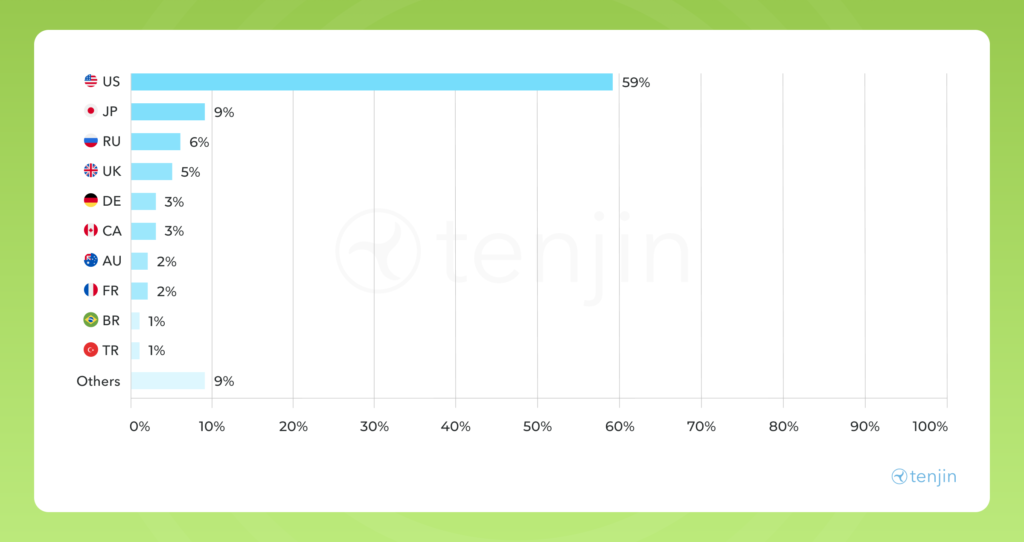
2026年第一季度数据显示,美国在iOS广告收入中的占比为56%,相比2025年第四季度的59%有所收窄。与此同时,日本市场份额从9%提升至11%,正逐渐成为不可忽视的重要市场。俄罗斯(6%)、英国(5%)、德国与加拿大(各3%)等市场继续保持稳定份额。
虽然美国市场依然占据主导地位,但全球收入结构正在悄然发生变化。对于拥有国际用户的开发者而言,将优化策略扩量到美国以外地区的重要性日益凸显。
2026年第一季度各国Android广告收入份额6
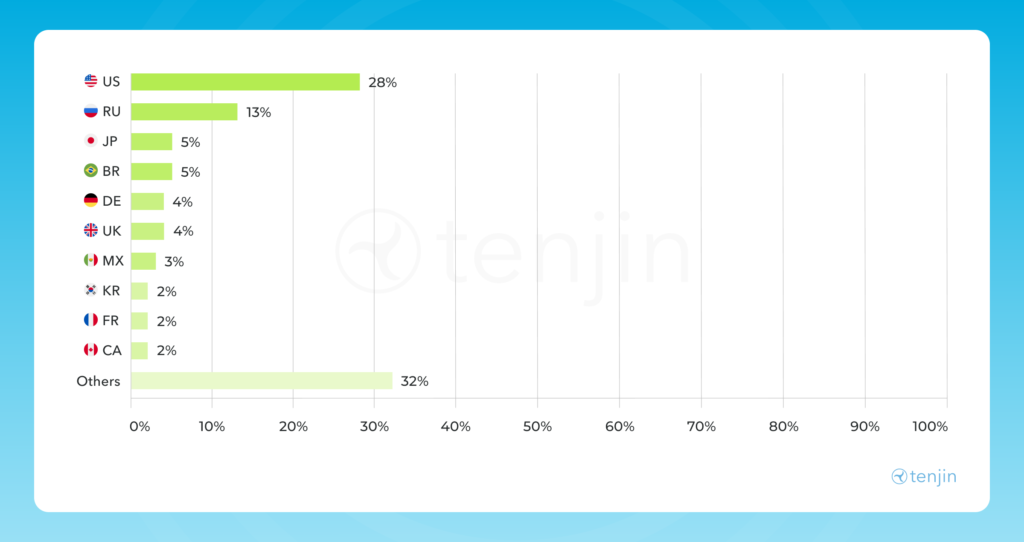
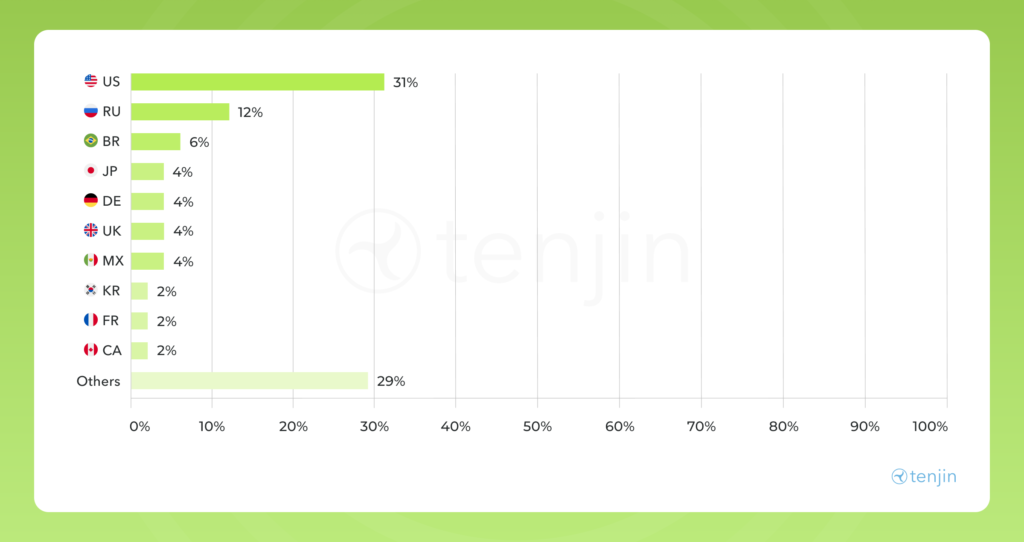
Android平台的全球收入版图正持续扩大。 The US leads Android ad revenue in Q1 2026 at 28%, down from 31% in Q4 2025. Russia holds second at 13%, up from 12%, with Japan at 5% and Brazil at 5%. Germany, the UK, Mexico, Korea, France, and Canada all sit between 2% and 4%, and Others accounts for a substantial 32%.
这32%的"其他地区"份额揭示了真实趋势:Android的收入基础真正实现了全球化布局,并持续向新兴市场渗透。虽然美国以外暂无单一市场形成绝对领先,但整体来看,这些地区整体构成了当前最具潜力的增长阵地。