Roman Garbar
June 4, 2026
Introduction
Earnings from showing ads in mobile games have seen better years, but despite the challenges, ad revenue opportunities remain strong. More and more game publishers are increasingly adopting “hybrid monetization” – a mix of in-app advertising (IAA) and in-app purchases (IAP).
While experts continue to debate the realistic ratio of IAA to IAP, whether it should be 50/50, 70/30, or 80/20, one thing is clear: ad revenue constitutes a significant portion of revenue for the majority of mobile publishers.
Tenjin has partnered with Clever Ads Solutions (CAS) to provide exclusive benchmark data to assist publishers. The report includes market share data for ad monetization channels and countries, based on a sample from Tenjin, as well as the average eCPM benchmark with a breakdown per country and format, based on data from CAS.AI.
The report will be periodically updated with data for each quarter.
Last updated on August 13, 2026.
- Q2 2026 dataset has been added.
- Q2 results are compared with Q1 2026 to highlight the latest platform, network, and geographic changes.
Q2 2026 Executive Summary
The Q2 2026 data shows four notable changes:
- iOS increased its share of total ad revenue from 43% to 45%.
- AppLovin gained ad revenue share on both iOS and Android.
- Mintegral declined by 5 percentage points on both platforms.
- The US increased its share of ad revenue on both platforms, reaching 58% on iOS and 32% on Android.
Android still generates the majority of ad revenue in the dataset, but the gap between Android and iOS narrowed from 14 percentage points in Q1 to 10 percentage points in Q2.
Ad Revenue Share by Platform in Q2 2026
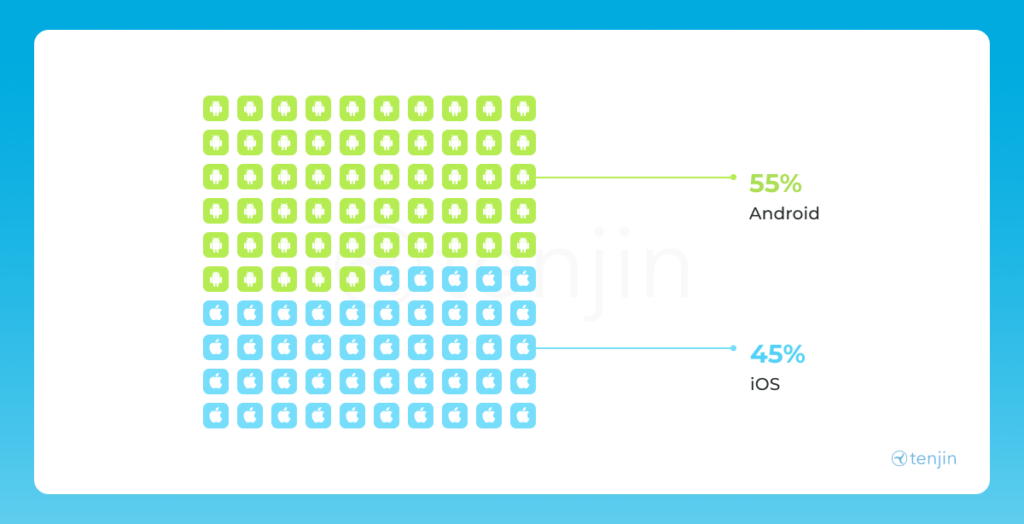
Android accounted for 55% of mobile game ad revenue in Q2 2026, compared with 45% for iOS.
This represents a 2-percentage-point shift toward iOS from Q1, when Android held 57% and iOS held 43%. Android remains the larger ad revenue platform, but the balance moved slightly closer in Q2.
The longer-term trend is therefore not a straight move toward Android. Platform share can shift from quarter to quarter, making it important for publishers to monitor actual revenue contribution rather than relying on assumptions about which operating system monetizes better.
Ad Revenue Share by Ad Network in Q2 2026
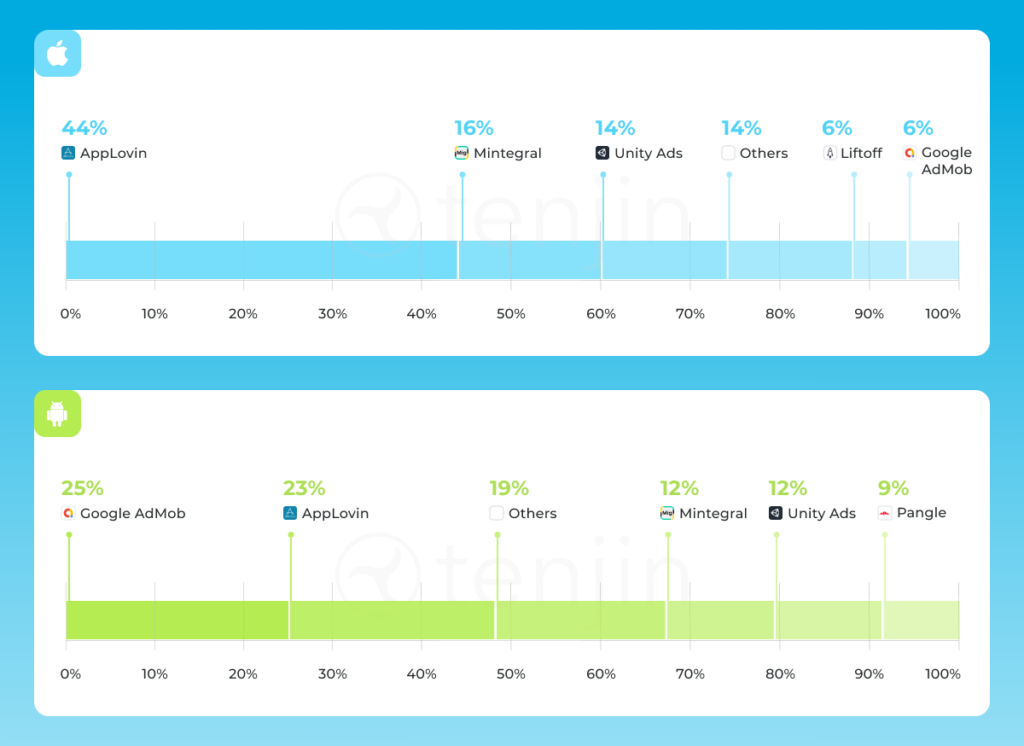
AppLovin strengthened its lead on iOS in Q2, increasing from 39% to 44% of ad revenue share. Mintegral moved in the opposite direction, falling from 21% to 16%.
Unity Ads and Others each increased slightly, from 13% to 14%. Liftoff and Google AdMob both declined from 7% to 6%.
As a result, the gap between the two largest iOS networks expanded considerably. AppLovin led Mintegral by 18 percentage points in Q1. By Q2, that lead had grown to 28 percentage points.
Android remained more competitive. Google AdMob held first place, increasing slightly from 24% to 25%, while AppLovin rose from 19% to 23%. The gap between the two leading Android networks narrowed from 5 percentage points to just 2.
Others remained unchanged at 19%, Unity Ads held steady at 12%, and Mintegral declined from 17% to 12%. Pangle appears as a separately identified network with 9% share in Q2, while Liftoff, which held 9% in Q1, is no longer shown separately.
The comparison reinforces how differently the two ecosystems behave. iOS became more concentrated around AppLovin, while Android retained a broader distribution across several networks.
Top 3 Ad Networks by Ad Revenue Growth YoY in Q2: 2025 vs 2026
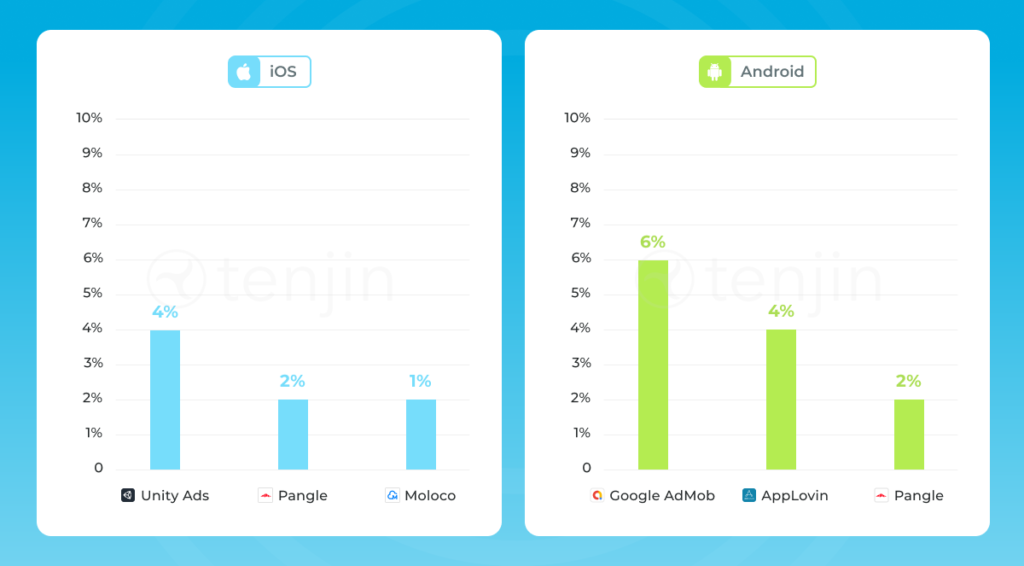
Unity Ads remained the leading network for year-over-year growth on iOS, increasing by 4%. It was followed by Pangle at 2% and Moloco at 1%.
Unity Ads was also the leading iOS growth network in Q1. However, the other two positions changed: Liftoff and Mintegral appeared in the Q1 ranking, while Pangle and Moloco entered the top three in Q2.
On Android, Google AdMob recorded the strongest year-over-year growth at 6%, compared with 3% in the Q1 year-over-year comparison. AppLovin followed at 4%, while Pangle remained among the top three with 2% growth.
This is a ranking of the networks recording the strongest year-over-year gains, not necessarily the networks generating the largest total share of ad revenue. Looking at both charts together helps distinguish market size from momentum.
iOS Ad Revenue Share by Country in Q2 2026
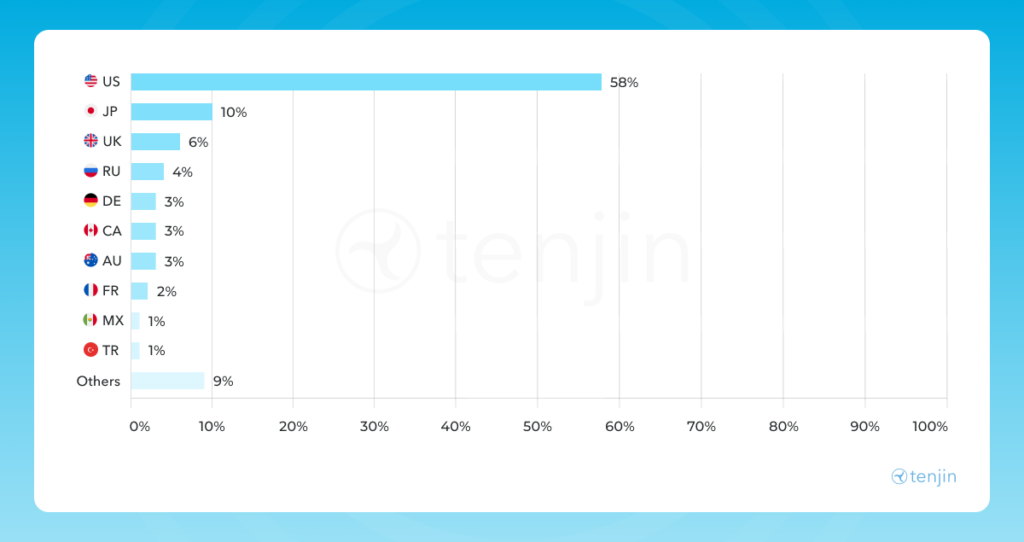
The US increased its share of iOS ad revenue from 56% in Q1 to 58% in Q2, reinforcing its position as the dominant iOS monetization market.
Japan remained second but declined slightly from 11% to 10%. The UK increased from 5% to 6%, overtaking Russia, which fell from 6% to 4%.
Germany and Canada remained unchanged at 3%. Australia increased from 2% to 3%, while France held steady at 2%. Mexico and Türkiye each accounted for 1%, and the share attributed to Others declined from 10% to 9%.
The overall picture became slightly more concentrated around the US. However, individual markets such as the UK and Australia still gained share, showing why country-level performance should be evaluated separately rather than through platform-wide averages alone.
Android Ad Revenue Share by Country in Q2 2026
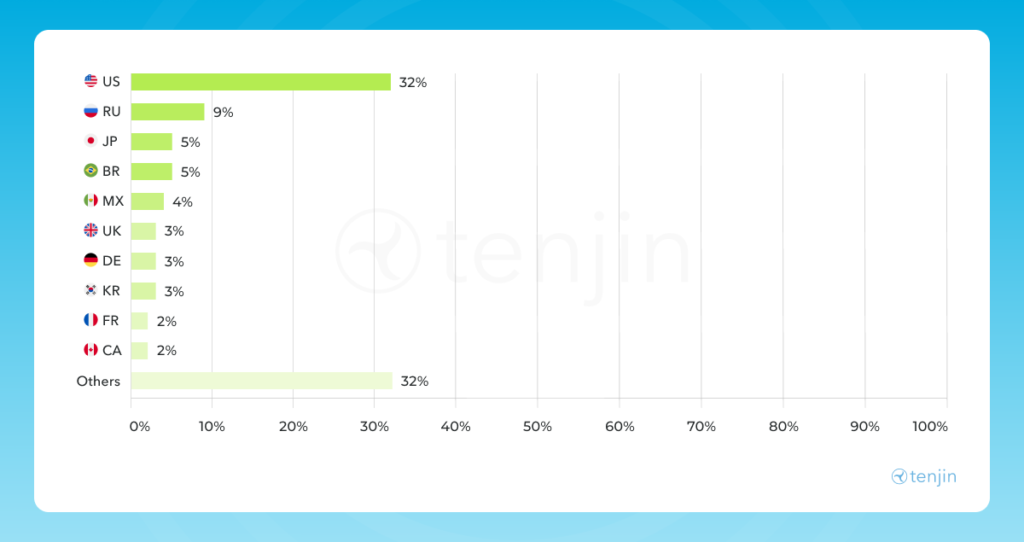
The US recorded the largest geographic increase on Android, rising from 28% in Q1 to 32% in Q2. Russia moved in the opposite direction, declining from 13% to 9%.
Japan and Brazil remained unchanged at 5%. Mexico increased from 3% to 4%, while South Korea moved from 2% to 3%. The UK and Germany each declined from 4% to 3%. France and Canada remained at 2%.
The share generated by countries outside the top ten remained unchanged at 32%. This is important because it shows that Android’s geographically distributed revenue base did not disappear. Instead, the most significant Q2 movement occurred between the two largest named markets, with the US gaining 4 percentage points and Russia losing 4.
Ad Revenue Share by Platform in Q1 2026
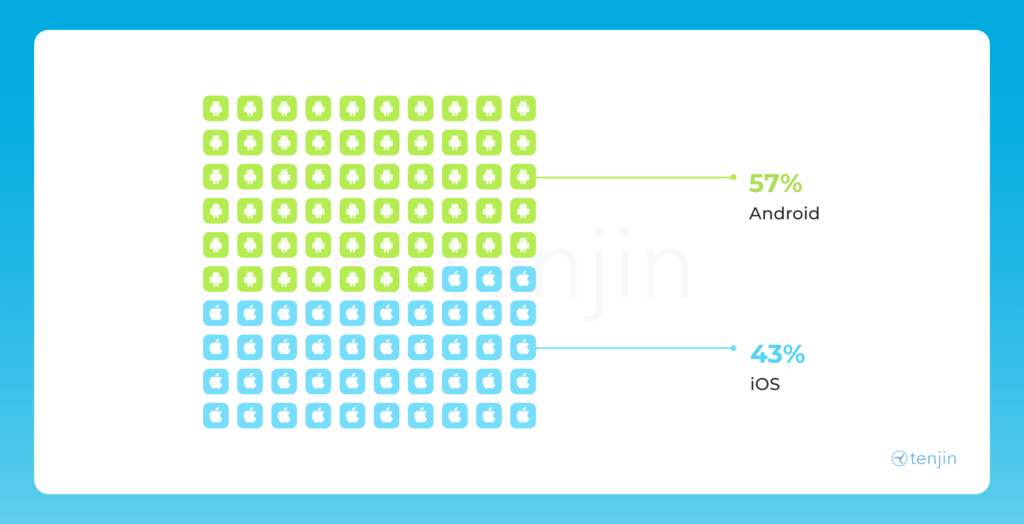
Android pulls ahead in ad revenue shares. In Q1 2026, Android accounts for 57% of ad revenue share compared to iOS at 43%. This builds on the directional shift we saw in Q4 2025, where Android held 60% of platform share against iOS at 40%. The trend is consistent and worth taking seriously.
While the split is not dramatic, it is meaningful. Android’s larger global install base has always been a volume story, but seeing it translate into a clear revenue majority signals that the monetization gap between the two platforms is closing.
Ad Revenue Share by Ad Network in Q1 2026
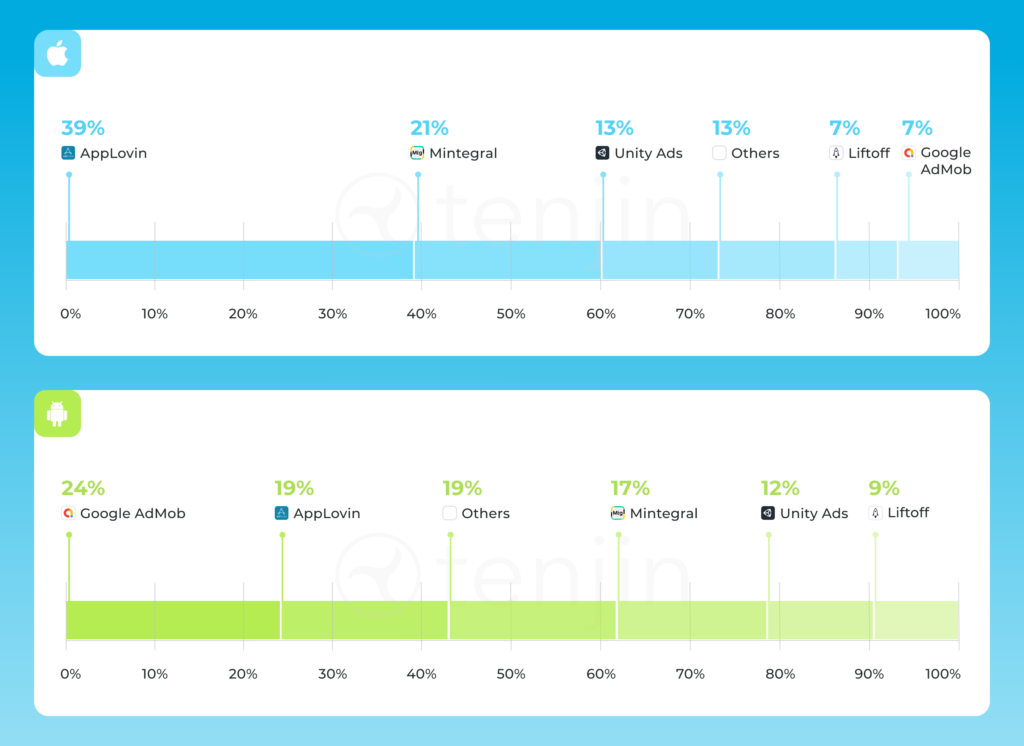
Network leadership is very different by platform. In Q1 2026, AppLovin commands 39% of iOS ad revenue share, a dominant position that leaves every other network trailing at a distance. Mintegral follows at 21%, with Unity Ads and Others both at 13%, and Liftoff and Google AdMob each at 7%.
Android is a different conversation entirely. Google AdMob leads at 24%, but the field is far more competitive. AppLovin sits at 19%, matching Others also at 19%, with Mintegral at 17%, Unity Ads at 12%, and Liftoff at 9%. No single network runs away with it.
The contrast between the two platforms reinforces a theme that has been consistent throughout this data.
Top 3 Ad Networks by Ad Revenue, Growth YOY Q1: 2025 vs 2026
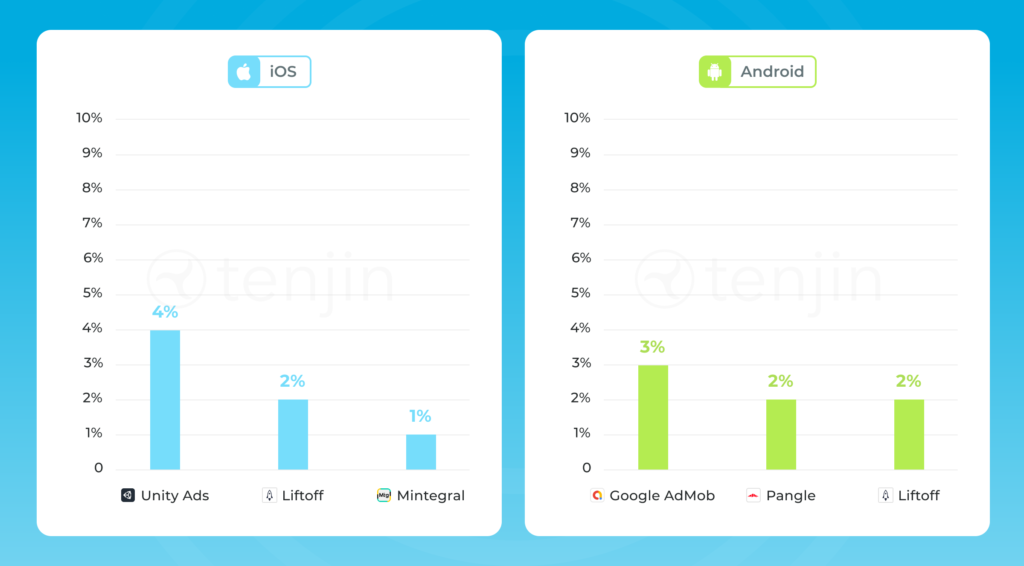
Growth is selective, and a pattern is forming. On iOS, Unity Ads leads year-over-year gains at 4%, followed by Liftoff at 2% and Mintegral at 1%. On Android, Google AdMob, Pangle, and Liftoff grew at 3%, 2%, and 2% respectively.
Compare this Q1 data to Q4 2025, where Pangle surged 7% on Android and Unity Ads led iOS growth at 4%. Although Pangle’s gains have slowed, it remains in the top three networks. Unity Ads and Liftoff are the two networks showing consistent growth across both platforms and both periods.
This shows that the networks worth watching are not always the biggest ones, but rather the ones that keep moving.
iOS Ad Revenue Share by Country in Q1 2026
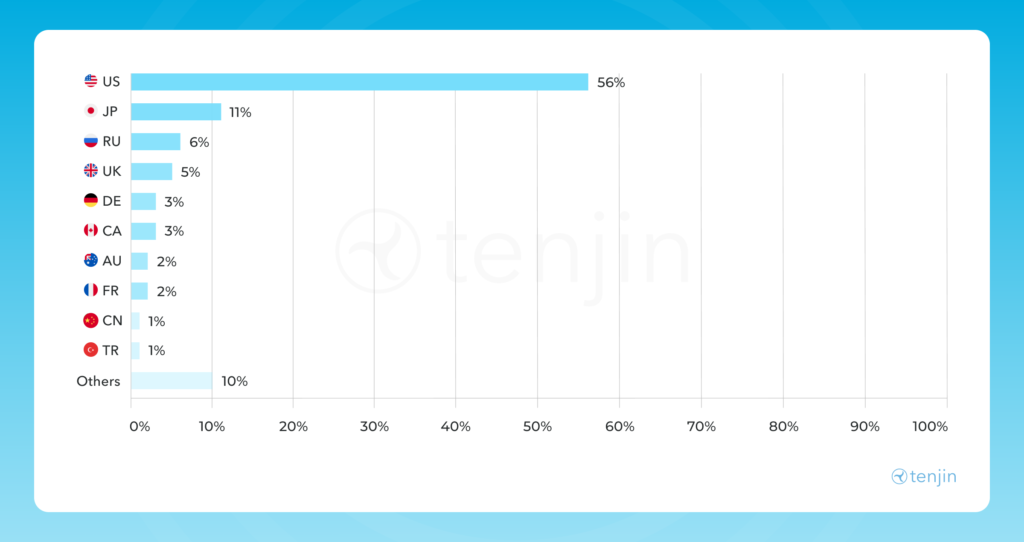
The US accounts for 56% of iOS ad revenue in Q1 2026, down from 59% in Q4 2025. Japan has grown from 9% to 11%, quietly becoming a more significant player. Russia holds at 6%, the UK at 5%, with Germany and Canada both at 3%.
The concentration is still real, but the distribution is slowly broadening. For developers with a global user base, the case for optimizing beyond the US is getting stronger.
Android Ad Revenue Share by Country in Q1 2026
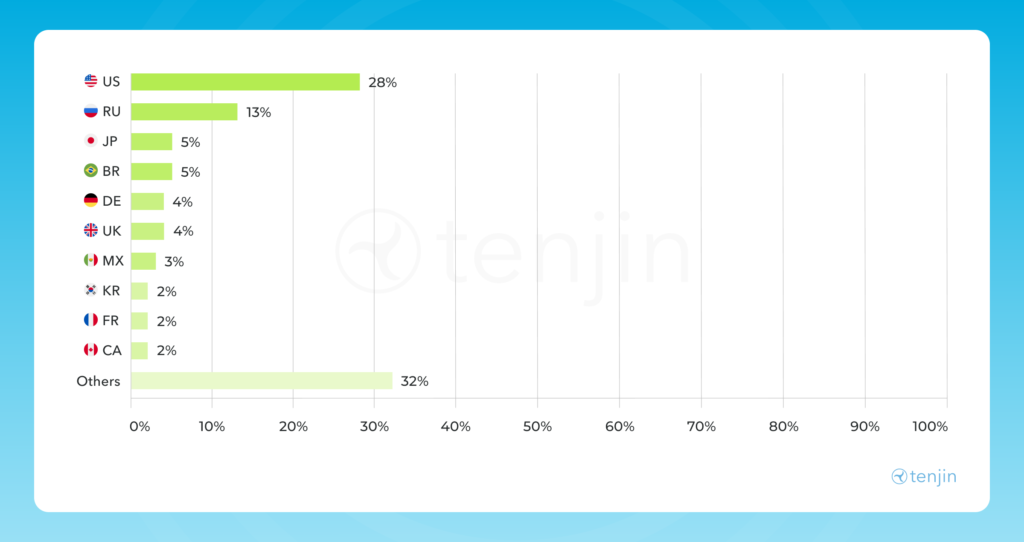
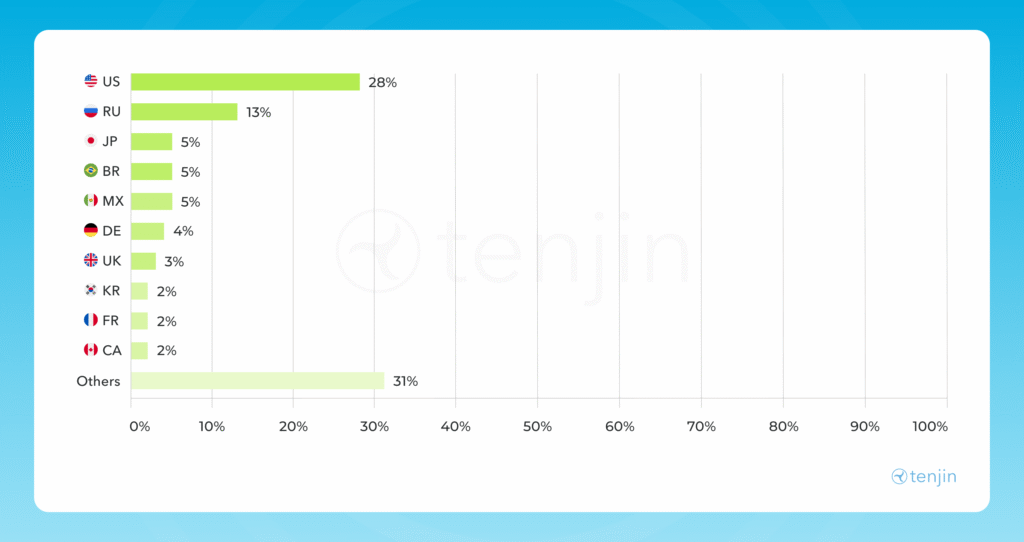
Android’s global revenue base continues to spread. The US leads Android ad revenue in Q1 2026 at 28%, down from 31% in Q4 2025. Russia holds second at 13%, up from 12%, with Japan at 5% and Brazil at 5%. Germany, the UK, Mexico, Korea, France, and Canada all sit between 2% and 4%, and Others accounts for a substantial 32%.
That 32% in “Others” tells the real story. Android’s revenue base is genuinely global and continues to fragment across emerging markets. No single region outside the US is pulling ahead, but collectively they are where the opportunity is.
Q3 2025 Data
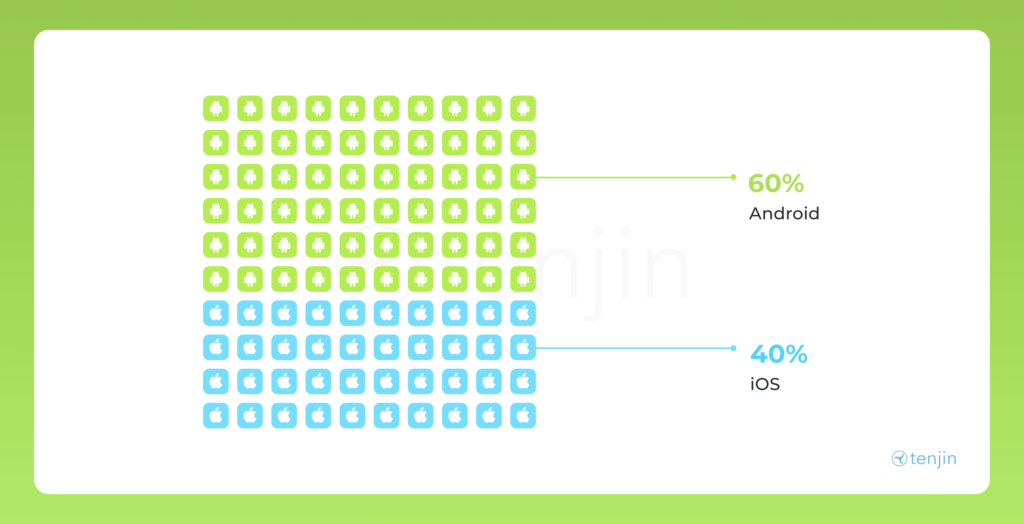
Revenue Share by Platform in Q4 2025

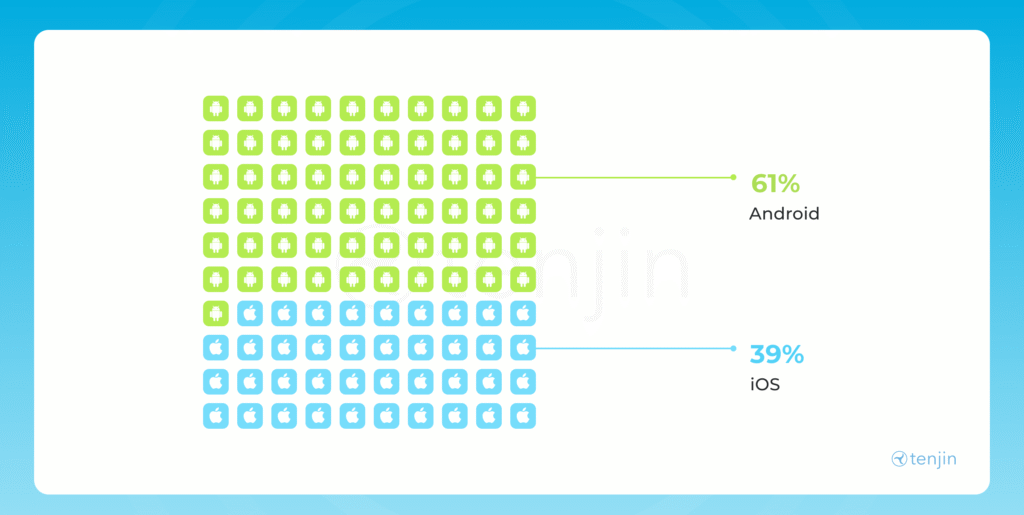
The platform split remains stable. The Android and iOS balance shifted only slightly quarter-over-quarter in Q3 to Q4 2025. Android moved from 61% to 60%, while iOS nudged up from 39% to 40%. This mix remains largely stable, but even marginal iOS growth is worth watching as monetization strategies continue to evolve across both platforms.
Ad Revenue Share by Ad Network iork in Q4 2025

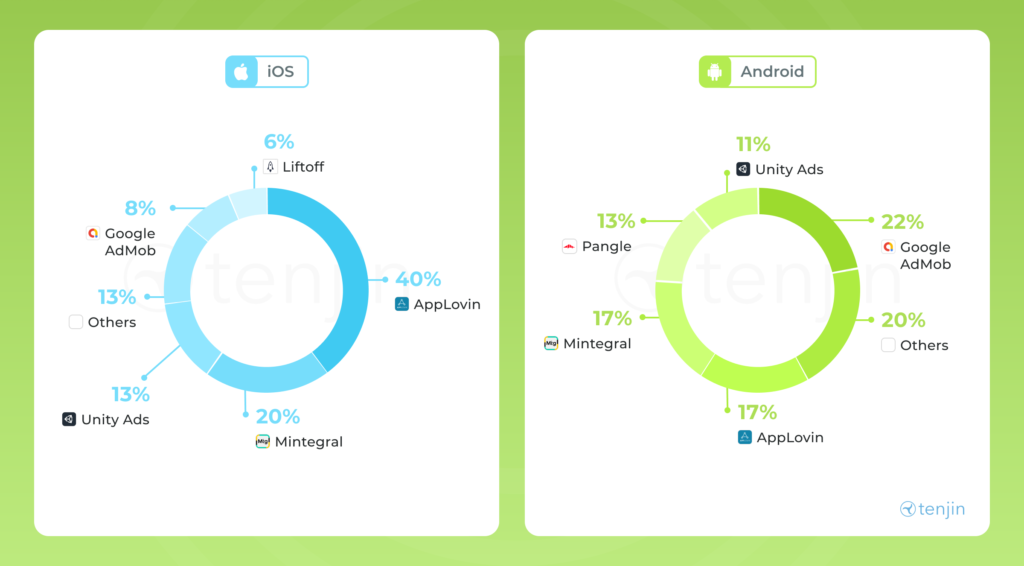
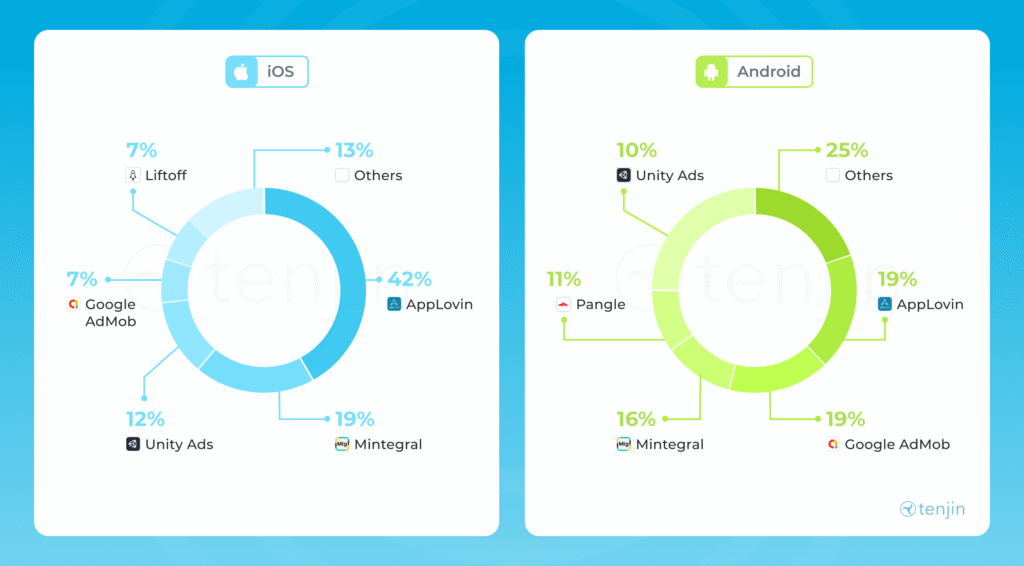
Which ad networks are the best for each platform? The network landscape looks different depending on where you’re building. On iOS, AppLovin dominates with 40% share, followed by Mintegral at 20%. On Android, Google AdMob leads at 22%, with Others and Mintegral close behind at 20% and 17% respectively, and AppLovin also at 17%.
This data demonstrates that network preferences are not universal. A strategy that performs on iOS won’t automatically translate to Android. Knowing where your spend is going, and why, is the first step to smarter monetization.n Q3 2025
Top 3 Ad Networks by Ad Revenue, Growth YOY Q4: 2024 vs 2025

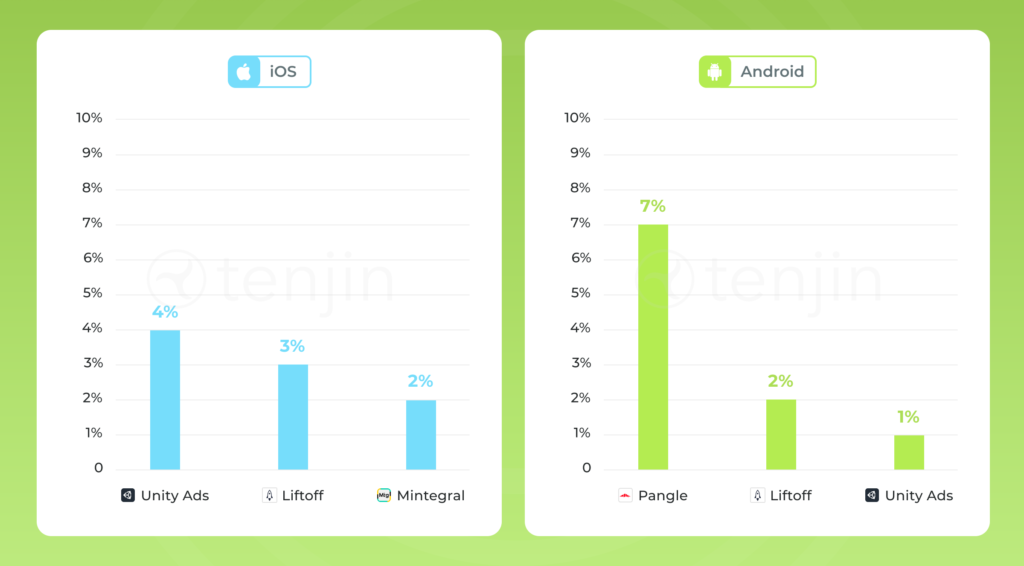
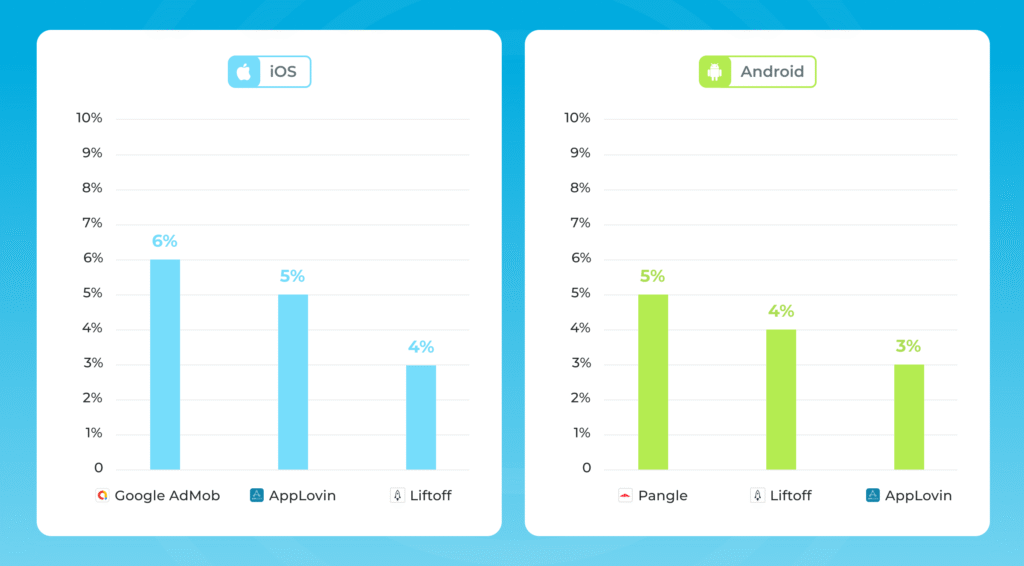
Growth is happening, but not for everyone. Not every network grew between Q4 2024 and Q4 2025, but the ones that did tell an interesting story. On iOS, Unity Ads led with 4% growth, followed by Liftoff at 3% and Mintegral at 2%. On Android, Pangle surged 7% year-over-year, the strongest single-network gain across both platforms, with Liftoff at 2% and Unity Ads at 1%.
Pangle’s Android momentum signals a shift in how developers are choosing to diversify their ad network mix. More and more, relying on a single network is no longer a viable growth strategy. Publishers with the strongest returns are tracking performance across every channel, spotting these shifts early, and reallocating accordingly.
The data to make these calls are accessible; a reliable mobile attribution kit helps give you a clarity so you can act and optimize faster.
iOS Ad Revenue Share by Country in Q4 2025

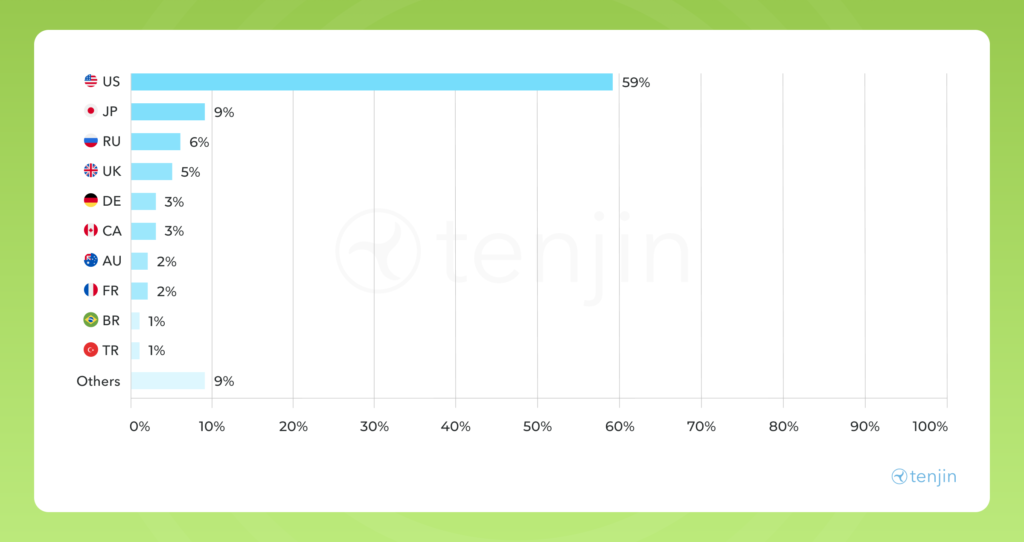
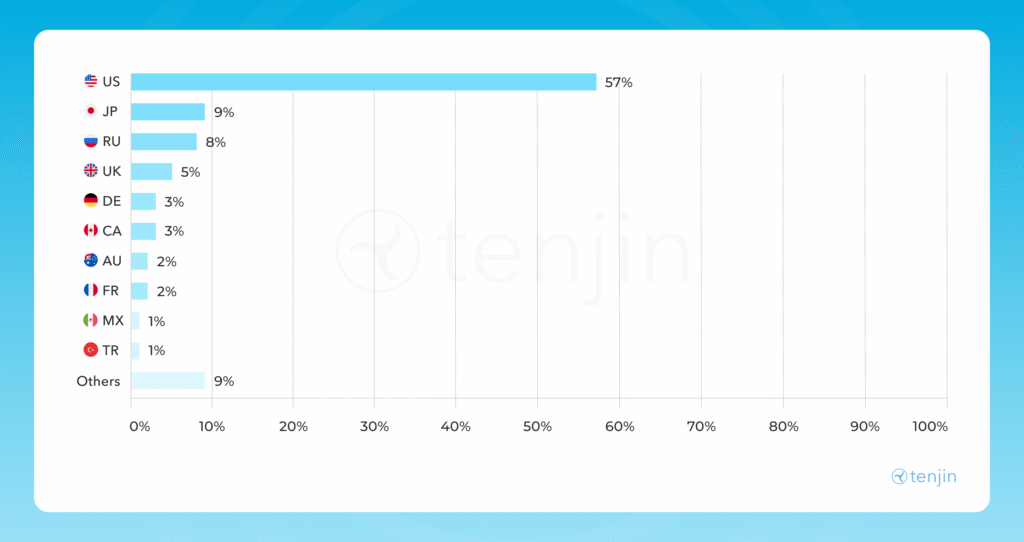
When it comes to iOS ad monetization, it remains a US-dominated landscape. The geographic concentration of iOS ad monetization in Q4 2025 continues to be striking. The US accounts for 59% of all activity, dwarfing every other market. Japan comes in second at 9%, followed by Russia at 6%, the UK at 5%, and Germany and Canada both at 3%.
The gap between the US and the rest of the world is a reminder that iOS monetization remains heavily weighted toward a single tier one market. For developers building global strategies, the opportunity in tier two markets like Japan, the UK, and Germany is real. However, with that there’s also a risk of underinvestment in the US.
Understanding your geographical breakdown at this level of granularity is what separates reactive monetization from intentional growth.
Android Ad Revenue Share by Country in Android Ad Revenue Share by Country in Q4 2025

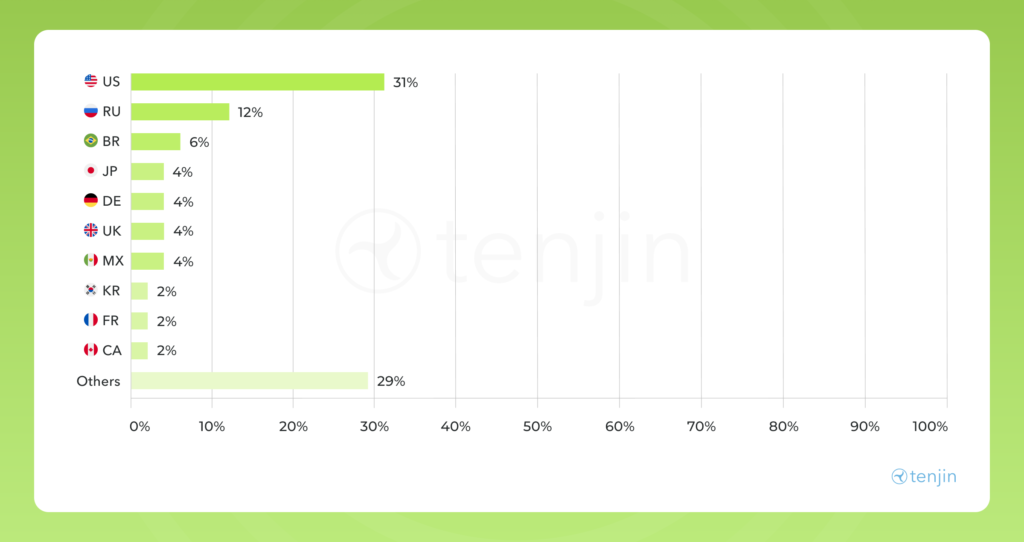
Unlike iOS, the patterns of ad monetization on Android reveals a more even distribution across the globe. While the US still leads in Q4 2025 at 31%, the gap between first and the rest of the field is considerably smaller than on iOS.
Russia comes in second at 12%, followed by Brazil at 6%, with Japan, Germany, the UK and Mexico all sitting at 4%. Korea and France follow at 2%, and Canada at 2%, with “Others” accounting for a significant 29%.
The 29% in the “Others” category is worth paying attention to. It points to a fragmented global audience, which no single market dominates. Android’s monetization opportunity has a more even spread across geographies than iOS. This means that app developers should consider localization, network selection, and budget allocation by region.Q3 2025
Q3 2025 Data
Ad Revenue Share by Platform in Q3 2025

Ad Revenue Share by Ad Network in Q3 2025

Top 3 Ad Networks by Ad Revenue, Growth YOY Q3: 2024 vs 2025

iOS Ad Revenue Share by Country in Q3 2025

Android Ad Revenue Share by Country in Q3 2025

Q2 2025 Data
Ad Revenue Share by Platform in Q2 2025

Ad Revenue Share by Ad Network in Q2 2025

Top 3 Ad Networks by Ad Revenue, Growth YOY Q2: 2024 vs 2025

iOS Ad Revenue Share by Country in Q2 2025

Android Ad Revenue Share by Country in Q2 2025

Q1 2025 Data
Ad Revenue Share by Platform in Q1 2025

iOS Ad Revenue Share by Ad Network in Q1 2025

Android Ad Revenue Share by Ad Network in Q1 2025

iOS Top 3 Ad Networks by Ad Revenue, Growth YOY Q1: 2024 vs 2025

Android Top 3 Ad Networks by Ad Revenue Growth: Q1 2024 vs Q1 2025

iOS Ad Revenue Share by Country in Q1 2025

Android Ad Revenue Share by Country in Q1 2025

2024 Data
Ad Revenue Share by Platform in Full-Year 2024

iOS Ad Revenue Share by Country in Full-Year 2024

Android Ad Revenue Share by Country in Full-Year 2024

iOS Ad Revenue Share by Ad Network in Full-Year 2024

Android Ad Revenue Share by Ad Network in Full-Year 2024

Executive Summary for Q2 2024

Ad Revenue Share by Platform in Q2 2024

iOS Ad Revenue Share by Country in Q2 2024

Android Ad Revenue Share by Country in Q2 2024

iOS Ad Revenue Share by Ad Network in Q2 2024

Android Ad Revenue Share by Ad Network in Q2 2024

Average eCPM per Ad Format in Q2 2024
Average eCPM for Banners by Country in Q2 2024


Average eCPM for Interstitial Ads by Country in Q2 2024


Average eCPM for Rewarded Ads by Country in Q2 2024


Executive Summary for Q1 2024

Ad Revenue Share by Platform in Q1 2024

This is a drastic change compared to five years ago. In 2019, iOS had 63% of the ad revenue share, while Android had 37%. Now, the situation has almost completely flipped. The change is largely driven by the introduction of App Tracking Transparency (ATT) in 2021. Most iOS users choose to opt out when seeing the ATT banner. Therefore, the value of those users diminishes for advertisers, and consequently, the potential ad revenue for publishers drops.
Tip: Increase ATT opt-in rates to boost your ad revenue on iOS.
iOS Ad Revenue Share by Country in Q1 2024

The market share on iOS is heavily skewed towards the USA (55%). Additionally, countries outside of the top 10, labeled “Others” in the image above, account for 10% of the market share worldwide.
Android Ad Revenue Share by Country in Q1 2024

On Android, the USA holds the top spot with a 33% market share. However, the market share is significantly more fragmented compared to iOS. Additionally, countries outside of the top 10, in terms of ad revenue, collectively account for 29% of the global market share.
iOS Ad Revenue Share by Ad Network in Q1 2024

The top 5 ad networks on iOS have an 88% ad revenue share, with Applovin leading the way. The data indicates that the ad monetization market for iOS is somewhat concentrated, with Applovin (37%) in the lead, followed by Unity Ads (16%), Google Admob (15%), Mintegral (11%), and ironSource (9%). Additionally, the other ad networks collectively represent 12% of the market. This suggests that while Applovin is the dominant player, the market still has a moderate level of fragmentation among the various ad monetization channels.
Android Ad Revenue Share by Ad Network in Q1 2024

Google AdMob (28%) is leading the ad monetization market share on Android, followed closely by Applovin (24%). Unity Ads (13%) and Mintegral (11%) hold significant portions as well. ironSource accounts for 5% of the market, while other ad networks collectively represent 19%. Together, Applovin and Google AdMob hold slightly more than half of the market share at 52%. This distribution shows a diverse market landscape with several key players contributing to the ad revenue on Android.

Average eCPM per Ad Format in Q1 2024
What is eCPM?
eCPM stands for “effective Cost Per Mille,” where “mille” is Latin for “thousand.” Essentially, eCPM indicates how much revenue a publisher earns for every 1,000 times an ad is shown in their app or website.
Average eCPM for Banners by Country in Q1 2024
Banners are small image ads placed within a game’s layout, visible to users throughout gameplay. These ads typically rotate automatically after a set period of time.
iOS

Android

Average eCPM for Interstitial Ads by Country in Q1 2024
Interstitial ads are full screen ads that can be videos, images, or interactive content. Interstitial Ads completely cover the game’s interface not allowing a user to continue to play the game unless they choose to close the ad or tap on it.
iOS

Android

Average eCPM for Rewarded Ads by Country in Q1 2024
Rewarded ads offer users the option to watch a video or play a mini-game in exchange for an in-app reward. These ads are initiated by the user.
iOS

Android

Overall, there is a noticeable growth in eCPM, which could be attributed to the increasing number of hybrid-casual games that employ hybrid monetization strategies. Users who are willing to make in-app purchases are valued higher, leading to increased competition for them among ad networks.
Methodology
The market share portion of this report consists of anonymized data based on 146 billion ad impressions collected by Tenjin for games of all genres in the date range of 01.01.2024 – 30.06.2024.
The average eCPM portion of the report is based on data from CAS.AI, encompassing 6 billion ad impressions and excluding kids apps.